Yesterday, we tested whether publication at the Appellate Court has any impact on a civil case’s reversal rate at the Supreme Court.  The answer is no – published Appellate Court decisions on the civil side are not consistently reversed at a higher or lower rate than unpublished decisions.  Today, we test the same question on the criminal side.

On the criminal side, we see an interesting result.  Between 1990 and 2003, published criminal decisions were reversed at a consistently higher rate than unpublished ones – published cases’ reversal rates were higher in thirteen of fourteen years.  From 2004 to 2017, the relationship has nearly inverted.  Of the fourteen years, published cases have had the higher reversal rate three times, the two sides have been tied in four years, and unpublished cases have had the higher reversal rate seven times.

In 1990, published criminal cases had a 51.61% reversal rate.  Unpublished decisions were reversed at a 44.74% rate.  In 1991, half the published cases were reversed, but only 13.33% of the unpublished decisions were.  In 1992, 70.73% of the published decisions were reversed.  Only 35.29% of the unpublished decisions were.

The reversal rate for unpublished criminal decisions stayed consistently low for another five years: 20% in 1993, 12.82% in 1994, 32.14% in 1995, 26.83% in 1996 and 29.27% in 1997.  In each of these years except 1993, the reversal rate for published decisions was between fifty and sixty percent.  The reversal rate for unpublished criminal decisions stayed below 50% from 1998 through 2003 (in fact, between 2000 and 2003, it was below 40%).

In 2004, one seat on the Court switched from Democratic to Republican.  Beginning with that year, unpublished criminal decisions were reversed at a much higher rate, and the numbers for published and unpublished decisions became quite similar.  In 2006, 44.44% of both published and unpublished decisions were reversed.  In 2007, 61.54% of published cases and 69.23% of unpublished ones were reversed.  In 2008, 47.83% of both published and unpublished decisions were reversed.  In 2010, half of both published and unpublished decisions were reversed, and in 2011, both sides finished at 48% reversals.

Since 2012, there’s been no consistent relationship between the reversal rates on the published and unpublished sides.  In 2012, 57.89% of published cases were reversed, and 35.71% of unpublished cases were.  In 2013, 52.17% of published cases were reversed, but two-thirds of unpublished cases were.  In 2014, 45.45% of published cases were reversed, and 27.27% of unpublished cases were.  In 2015, 63.16% of published cases were reversed, but 78.57% of unpublished cases were.  The numbers were similar in 2016 – 61.9% for published cases, 76.92% for unpublished cases.  Last year, 45.45% of published cases were reversed, and 41.67% of unpublished cases were.

Join us back here next Tuesday as we turn our attention to another question.

Image courtesy of Flickr by Katherine Johnson (no changes).

Last week, we looked at the conventional wisdom which holds that the Supreme Court only reviews published decisions from the Appellate Court.  We showed that in fact, Rule 23 orders (the Illinois term for unpublished decisions) are not unheard of on the Court’s civil docket – in a typical year, twenty to forty percent of the civil cases were unpublished below – and are downright commonplace in the criminal docket.

This week, we’re digging deeper on the issue of publication at the Appellate Court.  In order to understand better what kinds of cases make it to the Supreme Court despite being unpublished below, let’s compare the reversal rate for published Appellate Court decisions to the reversal rate on unpublished decisions.  It’s easy to posit conflicting theories as to how this analysis might come out.  Perhaps published decisions are given a harder look by the Court, leading to a higher reversal rate?  Or perhaps, given that they’re not precedential, what causes the Court to allow an appeal from an unpublished decision is the view that the case was clearly wrongly decided.  If that turns out to be true, one might expect the reversal rate for unpublished decisions to be higher than published ones.

In fact, there isn’t strong evidence for either of these theories, as we see in Table 682.  In thirteen of the past twenty-eight years, the reversal rate for published decisions has been higher; in fifteen years, the reversal rate has been higher for unpublished decisions.  In 1990, the numbers were almost identical – 60.71% of the published decisions were reversed, and 57.58% of the unpubs were.  The next year, the reversal rate for published decisions was flat at 62.79%, while 80% of the unpublished decisions were reversed.  By 1993, the two halves of the docket had diverged – 61.29% reversal of published decisions, 14.29% of unpublished ones, but for the next four years, the two sides were quite close.  In 1994, 55.56% of published decisions and 41.67% of unpublished decisions were reversed.  In 1995, 64.44% of published decisions and 81.82% of unpublished ones were reversed.  In 1996, 64.71% were reversed on the published side, 66.67% were reversed on the unpublished side.  The following year, 47.37% of published cases and 52% of unpublished ones were reversed.

In 2000, 57.14% of published cases and half the unpublished cases were reversed.  The following year, reversals among published decisions were down a bit to 44.83%, while they were static on the unpublished side.  In 2003 and 2004, the two sides were nearly equal – 56.76% and 50% for published decisions, 55.56% and 57.14% for unpublished ones.  For four of the five years between 2009 and 2013, reversals were at least a bit more common among published decisions than they were among unpublished ones (indeed, none of the Rule 23 orders reviewed in 2008 or 2013 were reversed).  In 2014, the reversal rate was exactly two-thirds in both published and unpublished decisions.  For 2015, 48.57% of published decisions and two-thirds of unpublished decisions were reversed.  In 2016, 45% of published decisions and 25% of unpublished ones were reversed.  Last year, half of the published decisions the Court reviewed on the civil side were reversed, but all of the unpublished decisions were.

Join us back here tomorrow as we look at the Court’s criminal docket.

Image courtesy of Flickr by David Wilson (no changes).


Yesterday, we looked at how large a share of the Court’s civil docket since 1990 has been accounted for by cases which were published at the Appellate Court.  Although there have been spikes in both directions from time to time, we showed that typically, 60-80% of the court’s civil cases were published below.  Today, we’re looking at the criminal side of the docket.

In Table 680, we report the raw numbers – criminal law decisions which were published below.  As you can see, the criminal docket is somewhat less dependent on published cases than the civil docket is.  In 1990, 31 of the criminal cases were published below.  In 1991, 28 were, and in 1992, 41 were.  But for the nine years that followed – from 1993 to 2001 – there were typically twenty or so published decisions a year.  In 2002, the figure jumped to 31.  In 2004, 42 criminal decisions were published below.  In 2005 and 2006, the number was 38 and 32, respectively.  Since then, for the most part, the data has reverted to trend.  In 2007, 15 criminal decisions were published below.  From 2008 to 2010, the number was up – 27 in 2008, 29 in 2009 and 33 in 2010 – but ever since that time, it’s back to trend.  In 2011, 2013 and 2014, 23 cases were published per year.  In 2012 and 2015, 19 cases were published each year.  In 2016 and 2017, 22 of the court’s criminal cases were published below.

On the civil side, we saw what initially appeared to be a long-term decline in the number of published Appellate Court decisions being decided by the Supreme Court – a decline which pretty much disappeared when we looked at published decisions as a fraction of the docket.  As you can see in Table 681 below, on the criminal side, there seems to be a persistent increase in the share of the docket accounted for by published cases below.

From 1990 to 1994, published Appellate Court decisions were between forty and fifty percent of the criminal docket – 44.93% in 1990, 48.28% in 1991, 44.57% in 1992, 41.86% in 1993 and 40% in 1994.  In 1995, 29.11% of the docket was published below.  In 1996, only 24.07% was.  The number jumped to 34.92% in 1997, but fell back to 22.22% in 1998, and – after another one-year spike – 22.09% in 2000.  In 2001, 32.76% of the criminal docket was published below.  In 2002, 44.29% was, and in 2003, 35.38% was.

In 2004, we see the beginning of a persistent upswing in the fraction of the criminal docket accounted for by published cases.  That year, 67.74% of the docket was published below.  The figure was almost identical in 2005 and 2006 – 64.41% and 64%, respectively.  In 2007, 53.57% of the docket was published.  In 2008, 54% was.  In 2009, 55.77% of the docket was published below, and in 2010, 60% was.  After a two year dip to 47.92% in 2011 and 57.58% in 2012, the share of the criminal docket accounted for by published cases has stayed steady – 60.53% in 2013, 67.65% in 2014, 57.58% in 2015, 62.86% in 2016 and 64.71% in 2017.

Join us back here next week as we continue our analysis of the Court’s decision making.

Image courtesy of Flickr by Geoff Livingston (no changes).

Last time, we looked at the data on cases which had a dissenter at the Appellate Court, and whether they’re more likely to have at least one dissenter at the Supreme Court.  This week, we’re looking at a new question – how much of the court’s civil and criminal dockets consists of decisions which were published at the Appellate Court?

In Table 678, we report the number of civil cases the court decided which were published at the Appellate Court.  On the face of it, it seems that published decisions are declining on the Court’s civil docket.  In 1990, fifty-six of the court’s civil decisions were published below.  In 1991, that dropped to 43, but in 1992 and 1994, it was even higher: 67 in 1992, 63 in 1994.

In 1995, 45 of the Court’s civil decisions were published below.  Since then, the yearly number has generally been in the high 20s and 30s.  In 1996, 34 of the court’s civil decisions were published below.  In 1997, 38 were.  Forty-seven were in 1998, but in the next five years, that fell to 30, 28, 29, 36 and 37.  Forty civil decisions were published below in 2004.  In 2005, 33 were.  In 2006, it was 43.  In 2007, 29 civil decisions were published below.  In 2008, 40 cases were published, but the number has been consistently lower since: 33 in 2009, 29 in 2010, 36 in 2011, 34 in 2012, 31 in 2013, 15 in 2014, 35 in 2015, 20 in 2016 and 25 in 2017.

But these are just the raw numbers.  Is the apparent drop in published lower court decisions in the Court’s civil docket a real trend, or a result of the total caseload edging downward in recent years?  In our next table, we report published Appellate Court decisions as a percentage of the total civil docket.

The table shows that the apparent downward trend in civil cases published below is indeed a result of a slightly lower case load, rather than the court consistently hearing more Rule 23 orders.  In 1990, 62.92% of the Court’s civil decisions were published below.  In 1991, it was 81.13%; in 1992, 72.83%; in 1993, 82.05%; in 1994, 84%, and in 1995, 80.36%.  In 1996, 61.82% of the court’s civil decisions were published below.  That figure remained fairly flat for the next two years – 60.32% in 1997, 66.2% in 1998.  In 1999, 73.17% of the civil docket was published below.  In 2000, 73.68% was.  In 2001, 56.86% of the civil docket was published below.  In 2002, 72% was.  The following year, 80.43% was published below, but in 2004, the number fell slightly to 74.07%, and again in 2005 to 68.75%.

In 2006, 87.76% of the civil decisions were published below.  There was a one-year dip in 2007 to 70.73%, but the number was consistent for the six years following: 95.24% in 2008; 80.48% in 2009; 87.88% in 2010; 94.74% in 2011; 85% in 2012 and 91.18% in 2013.  In 2014, the published share of the civil docket dropped to 55.56%, but it rose back to 79.55% in 2015, 71.43% in 2016 and 92.59% in 2017.

Join us back here tomorrow as we review the numbers for the criminal side of the docket.

Image courtesy of Flickr by Marco Verch (no changes).

Yesterday, we looked at the year-by-year data on the civil side of the docket, asking whether a dissent at the Appellate Court tends to indicate that one or more dissenters are likely at the Supreme Court.  Today, we’re looking at the same question on the criminal side.

In Table 676, we report the absolute numbers – how many unanimous decisions had a dissent below, and how many non-unanimous decisions did.  Although the number is nearly always higher among unanimous decisions, of course, unanimous decisions are far more common in the criminal docket than non-unanimous decisions are.

So in Table 677, we report the same data as a fraction of the whole – what percentage of unanimous and non-unanimous decisions had a dissenter below.  Here, we see indications that on the criminal side, dissent at the Appellate Court actually is a moderately successful predictor that the Supreme Court will be divided – in seventeen of twenty-eight years, the share of non-unanimous decisions which were divided was higher than the share of unanimous decisions.

In 1990, the numbers were nearly equal – 21.82% unanimous decisions, 21.43% non-unanimous.  In 1991, twice as many unanimous decisions had a dissent below – 29.55% of unanimous decisions, 14.29% of non-unanimous ones.  But in 1992, only 9.21% of unanimous decisions had a dissent below, while one-quarter of the non-unanimous decisions did.  In 1993, none of the unanimous decisions had a dissent below, but 14.29% of the non-unanimous cases did.  In 1994, 12.5% of the Court’s unanimous criminal cases had a dissent below, but 20% of the non-unanimous criminal decisions did.

None of the Court’s unanimous criminal decisions in 1995 and 1996 had a dissent below; 9.38% of the non-unanimous decisions in 1995 and 5.88% in 1996 did.  In 1997, 7.89% of the unanimous decisions and 12% of the non-unanimous decisions were divided below.  In 1998, 6% of the unanimous decisions and 9.09% of the non-unanimous decisions were divided below.  In 1999, 20.83% of the unanimous decisions and 6.9% of the non-unanimous decisions were divided.  The following year, 8.7% of the unanimous decisions and 6.35% of the non-unanimous decisions had dissenters below.

In 2001, 11.43% of the Court’s unanimous criminal decisions and 4.35% of the non-unanimous decisions had a dissent below.  In 2002, the numbers were similar: 13.16% of unanimous decisions, 6.25% of non-unanimous decisions.  In 2003, 14.29% of unanimous decisions and 13.33% of non-unanimous decisions were divided below.  In 2004, 25.53% of unanimous decisions had a dissent below, but 40% of the non-unanimous decisions did.  In 2005, a quarter of the Court’s unanimous criminal decisions had a dissent, but 36.36% of the non-unanimous decisions did.  In 2006, 19.44% of the unanimous decisions and 28.57% of the non-unanimous decisions were divided below.  In 2007, one quarter of the unanimous criminal decisions and 37.5% of the non-unanimous decisions were divided.  In 2008, the sides of the criminal docket were virtually identical – 26.19% of the unanimous decisions and one-quarter of the non-unanimous decisions were divided below.  In 2009, only 7.5% of the unanimous criminal decisions were divided below, but once again, a quarter of the non-unanimous decisions were.

In 2010, 31.71% of the unanimous criminal decisions and 28.57% of the non-unanimous decisions had a dissenter below.  The following year, 18.92% of the unanimous decisions had a dissenter below, but nearly half of the non-unanimous decisions did (45.45%).  In 2012, 21.74% of the unanimous decisions were divided, and forty percent of the non-unanimous decisions were.  In 2013, 17.86% of the unanimous decisions had a dissenter below, but none of the non-unanimous cases did.  In 2014, 22.22% of the unanimous decisions and 28.57% of the non-unanimous decisions were divided below.  In 2015, 29.63% of the unanimous criminal decisions and half of the non-unanimous decisions were divided.  In 2016, 21.43% of the unanimous decisions and 14.29% of the non-unanimous decisions were divided.  Last year, the two sides of the criminal docket were nearly identical – 20% of the unanimous decisions and 22.22% of the non-unanimous ones had a dissenter below.

Join us back here next week as we continue our ongoing analysis of the Court’s decision making.

Image courtesy of Flickr by RussellStreet (no changes).

Last time, we tracked the year-by-year data, testing the proposition that most of the Court’s cases are sufficiently “close calls” to have brought a dissent at the Appellate Court.  This week, we’re testing another proposition – does dissent at the Appellate Court suggest that there’s going to be one or more dissenters at the Supreme Court?

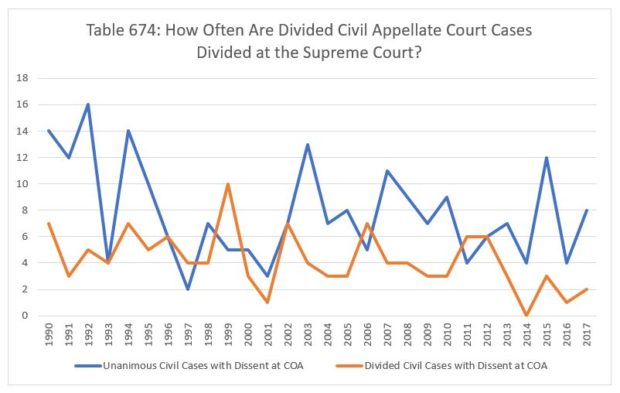
In Table 674, we track the absolute numbers – how many of the Court’s unanimous civil decisions had a dissent below versus how many of the Court’s non-unanimous decisions did.  We see in the blue line that in most years – twenty of twenty-eight, to be precise – there are more unanimous decisions than non-unanimous ones arising from divided decisions below.

In Table 675, we report the same data with the number of divided Appellate Court decisions on each side of the ledger reported as a portion of the whole: in other words, if the Court decided three civil cases unanimously, and one had a dissent at the Appellate Court, then we would report 33.33%.

Evaluated this way, it begins to appear that dissent at the Appellate Court is not a strong predictor of dissent at the Supreme Court.  A higher portion of non-unanimous civil decisions had a dissent below in fifteen of the twenty-eight years.

In 1990, 20% of the unanimous civil cases and 36.84% of the non-unanimous ones had a dissent below.  In 1991, 30% of the unanimous decisions and 23.08% of the non-unanimous ones did.  In 1992, 25.81% of the unanimous decisions had a dissent below, but only 16.67% of the non-unanimous ones did.  In 1993, 16.67% of the unanimous decisions and 28.57% of the non-unanimous ones had a dissent below.  The following year, 34.15% of the unanimous decisions and 20.59% of the non-unanimous decisions had a dissent below.  In 1995, the numbers were roughly equal – 28.57% of unanimous decisions and 23.81% of non-unanimous ones had a dissent below.  In 1996, 17.65% of unanimous civil decisions and 28.57% of non-unanimous decisions had a dissent below.  In 1997, the numbers dropped on both sides, to 6.45% of unanimous decisions and 12.5% of non-unanimous decisions.  In 1998, 20.59% of unanimous decisions and 10.81% of non-unanimous decisions were divided below.

In 1999, a quarter of unanimous civil decisions had a dissent below, but 47.62% of non-unanimous decisions did.  In 2000, 22.73% of unanimous decisions and 18.75% of non-unanimous decisions were divided below.  In 2001, both sides fell sharply – 7.89% of unanimous decisions, 7.69% of non-unanimous cases.  The following  year, 21.21% of unanimous civil decisions had a dissent below, but 41.18% of non-unanimous cases did.  In 2003, the relationship flipped – 28.57% of non-unanimous decisions were divided below, but 40.63% of unanimous decisions were.  In 2004, 17.5% of unanimous decisions were divided, but 21.43% of non-unanimous decisions were.

For the next two years, the share on both sides was fairly stable – 20.51% (2005) and 17.24% (2006) for unanimous decisions, 33.33% (2005) and 35% (2006) for non-unanimous cases.  In 2007, a third of the unanimous civil decisions were divided below, but fully half of the non-unanimous decisions were.  In 2008, 30% of unanimous decisions were divided below, and a third of non-unanimous decisions were.  In 2009, 20.59% of unanimous decisions and 42.86% of non-unanimous decisions were divided.  In 2010, the numbers were close to equal – 37.5% of unanimous decisions and one-third of the non-unanimous civil decisions.  In 2011, only 13.79% of the unanimous civil decisions had a dissenter below, but two-thirds of the non-unanimous decisions did.  The following year, things were much closer again, as 27.27% of the unanimous decisions and a third of the non-unanimous decisions were divided below.  In 2013, 35% of unanimous decisions and only 21.43% of non-unanimous decisions had a dissenter.  In 2014, 19.05% of unanimous decisions had a dissenter below, but none of the non-unanimous cases did.  In 2015, 34.29% of unanimous decisions had a dissenter below, and a third of the non-unanimous cases did.  In 2016, 19.05% of unanimous decisions were divided, but only 14.29% of non-unanimous cases were.  Last year, 38.1% of the Court’s unanimous civil decisions had a dissenter below, and 40% of the non-unanimous decisions did.

Join us back here next time as we review the Court’s criminal docket.

Image courtesy of Flickr by Marco Verch (no changes).

Last time, we looked at the share, year by year, of the Court’s civil docket accounted for by decisions which brought a dissent at the Court of Appeal.  Today, we’re looking at the data for the criminal docket.

The Court decided fifteen criminal cases in 1990 and 1991 which were divided below.  The Court decided eleven divided cases in 1992, but only one in 1993.  The Court decided ten divided cases in 1994.  The Court decided three divided cases in 1995, one in 1996, six in 1997, five in 1998, seven in 1999, six in 2000, five in 2001, seven in 2002 and nine in 2003.

In 2004 and the two years following, the number of divided criminal cases increased – to 18 in 2004, 16 in 2005 and eleven in 2006.  The Court decided eight divided cases in 2007, thirteen in 2008, six in 2009, eighteen in 2010 and twelve in 2011.  The Court decided nine divided criminal cases in 2012, five in 2013, eight in 2014, eleven in 2015 and seven per year in 2016 and 2017.

So how much of the total criminal docket was accounted for by divided decisions below?  In 1990, 21.74% of the Court’s criminal docket was divided below.  In 1991, 25.86% was.  In 1992, only 11.96% were, and in 1993, the fraction fell to 2.33%.  In 1994, 15.38% of the Court’s criminal docket was divided below, but the share fell to 3.8% in 1995, 1.85% in 1996, 9.52% in 1997 and 6.94% in 1998.  In 1999, 13.21% of the Court’s criminal docket was divided below.  In 2000, 6.98% was, and in 2001, the share was 8.62%.  In 2002, 10% of the criminal docket was divided below.  In 2003, 13.85% of the docket was divided below, but the share was 29.03% in 2004, 27.12% in 2005, 22% in 2006, 28.57% in 2008 and 26% in 2008.  The divided share fell to 11.54% in 2009, but rose to 32.73% in 2010, 25% in 2011 and 27.28% in 2012.  The share fell to 13.16% in 2013, but that was a one year fall.  In 2014, 23.53% of the criminal docket was divided decisions below.  In 2015, exactly one third of the criminal docket was divided below.  In 2016, 20% of the docket was divided and 20.59% was in 2017.

Join us back here next time as we continue our analysis of the Court’s decision making.

Image courtesy of Flickr by David Ohmer (no changes).

This week, we’re beginning a new topic in our ongoing study of the Court’s decision making.  One often hears that unless there’s a dissent at the Appellate Court level, there’s no chance that the Supreme Court will agree to hear the case.  So – how true is that?  How much of the Supreme Court’s docket consists of divided decisions below?

In Table 670, we report the absolute numbers of divided decisions, year by year, on the civil side.  The Court decided twenty-one divided cases in 1990, fifteen in 1991, twenty-one in 1992, 8 in 1993, twenty-one in 1994, fifteen in 1995 and twelve in 1996.  The Court decided six civil cases which were divided below in 1997, eleven in 1998, fifteen in 1999, eight in 2000 and four in 2001.  The Court decided fourteen divided civil cases in 2002, seventeen in 2003, ten in 2004, eleven in 2005, twelve in 2006, fifteen in 2007, thirteen in 2008, ten in 2009 and twelve in 2010.  The Court decided ten divided civil cases in 2011, twelve in 2012, ten in 2013, four in 2014, fifteen in 2015, five in 2016 and ten in 2017.

In Table 671, we report the percentage of the Court’s civil docket accounted for by divided decisions from the Court of Appeal.  Each year from 1990 to 1996, between twenty and thirty percent of the Court’s civil docket was divided decisions below: 23.6% in 1990, 28.3% in 1991, 22.83% in 1992, 21.05% in 1993, 28% in 1994, 26.79% in 1995 and 21.82% in 1996.  Only 9.52% of the Court’s civil docket was divided decisions below in 1997, but 15.49% was in 1998.  In 1999, 36.59% of the Court’s cases were divided below.  In 2000, 21.05% of the Court’s civil cases were divided.  Only 7.84% were divided below in 2001, but 28% were in 2002 and 36.96% were in 2003.  In 2004, 18.52% of the Court’s civil cases were divided decisions below.  Divided decisions accounted for 22.92% in 2005 and 24.49% in 2006.

In 2007, 36.59% of the Court’s civil cases were divided below.  In 2008, 30.95% were.  The numbers fell to 24.39% in 2009, but in 2010, 36.36% were divided below.  In 2011, 26.32% of the Court’s civil cases were divided decisions below.  In the years since, the share accounted for by divided decisions has fluctuated from just below 20 to nearly forty percent – 30% in 2012, 29.41% in 2013, 14.81% in 2014, 34.09% in 2015, 17.86% in 2016 and 38.46% in 2017.

Join us back here next time as we turn our attention to the Court’s criminal docket.

Image courtesy of Flickr by HystericalMark (no changes).

Yesterday, we reviewed the overall data for the period 1990 through 2017 of the originating counties for the Supreme Court’s civil docket.  Today, we’re looking at the Court’s criminal docket.

Cook County accounted for 41.46% of the Court’s criminal docket between 1990 and 2017 – a slightly less predominant position than in the civil docket.  Du Page County produced 5.41% and Will County accounted for 5.08%.  Kane County produced 3.98% and Lake County accounted for 3.85%.  Champaign County produced 2.67%, the ARDC was 2.54% of the docket, and Peoria County produced 2.54%.  McLean County produced 2.09% of the docket.  St. Clair County produced 1.89%, Winnebago County 1.83%, and Kankakee County 1.76%.  Madison County accounted for 1.56%, Livingston 1.37%, Vermilion 1.24% and Sangamon County produced 1.04%.  Rock Island and Henry counties accounted for 0.98% of the Court’s criminal cases.  La Salle County accounted for 0.91%, Adams County 0.78%, Macon County 0.72%, Bureau County 0.65%, and Jefferson County produced 0.59%.

McHenry, Grundy and Tazewell counties accounted for 0.59% of the Court’s criminal docket each.  Whiteside, Coles and Boone counties accounted for 0.52%.  Randolph, Williamson and Ogle counties produced 0.46% of the criminal docket each.   Jackson, Clinton, Marion, Montgomery, Hancock, Macoupin and De Kalb counties produced 0.39% of the criminal docket.  Stephenson and Effingham counties produced 0.33%.  Knox, Iroquois, Jo Daviess, Warren, Pike and Kendall counties accounted for 0.26% each.

Union, Schuyler, Mason, Douglas, Lee, Ford and Wayne counties all accounted for 0.2%, and unknown trial courts were 0.2% too.  The following counties produced 0.13% of the Court’s criminal docket: Edgar, Saline, McDonough, Fayette, Cumberland, Piatt, Fulton, Massac, Woodford, Logan and Morgan.

Johnson and Stark counties both accounted for 0.13% of the Court’s criminal docket.  A great many jurisdictions produced one case each: Wabash, Pope, Jasper, Mercer, El Paso, Shelby, Menard, Pulaski, Washington, Alexander, Moultrie, Greene, Clark, Jersey, Perry and Hamilton counties, original jurisdiction cases, and administrative cases on direct appeal.

Join us back here next Tuesday as we turn our attention to another issue in the Illinois Supreme Court’s decision making.

Image courtesy of Flickr by Trailnet (no changes).

Over the past several weeks, we’ve been tracking the county trial courts which have produced the Supreme Court’s civil and criminal dockets between 1990 and 2017.  This week, we’re reviewing the overall data for the entire period.

Between 1990 and 2017, Cook County accounted for 44.68% of the Court’s civil cases.  Du Page County produced 5.83%, Lake produced 4.36% and Sangamon County accounted for 4.28%.  Direct administrative appeals were 3.84%, St. Clair County was 3.69% and Madison County was 3.25%.  Will County produced 2.36% of the Court’s civil cases and Champaign County accounted for 2.22%.  Seven cases produced between one and two percent of the Court’s civil cases – Peoria, 1.99%; Kane, 1.77%; McLean, 1.4%; McHenry, 1.18%; Winnebago, 1.11, and Jackson and Macon – 1.03% each.  Rock Island County produced 0.96% of the Court’s civil docket.  Williamson County accounted for 0.89% and La Salle County produced 0.86%.  Original jurisdiction cases, certified question appeals from the Northern District of Illinois and Franklin County produced 0.66% of the Court’s civil docket each.

Tazewell County accounted for 0.59% of the Court’s civil docket.  Vermilion, Marion and Jefferson County produced 0.52% each.  Macoupin County accounted for 0.37%.  Eight counties produced 0.3% of the Court’s civil docket – Grundy, Christian, Ogle, Effingham, Knox, Adams and Kendall counties, and cases in which the county trial court could not be identified.   Bureau, Johnson, Menard, Boone, Putnam, Randolph, Morgan, Lee, Stephenson, Coles and McDonough counties have all accounted for 0.22% of the Court’s civil docket.

Thirteen counties accounted for 0.15% of the Court’s civil docket – Warren, Douglas, Kankakee, Wabash, De Kalb, Greene, Ford, Henry, DeWitt, Montgomery, Edgar, Piatt and Clinton.  Marshall, Iroquois, Alexander, Wayne, Bond, Lawrence, Hamilton, Logan, Mason, Moultrie and Clark counties all produced 0.07% of the Court’s civil docket apiece.

In Table 665, we report the remainder of the civil docket counties.  The following counties produced 0.07% of the Court’s civil docket each: Monroe, Hardin, Pope, Crawford, Union, Perry, Scott, Pike, Cumberland, Fayette, Jersey, Massac, Woodford, Washington and Saline.  Finally, 0.07% of the Court’s civil docket originated in the United States District Court for the Central District of Illinois.

Join us back here tomorrow as we review the overall data for the Court’s criminal docket.

Image courtesy of Flickr by Wally Slowik, Jr. (no changes).