229592471_3d9c37e724_z

For the past two weeks, we’ve been tracking the areas of law covered in the Illinois Supreme Court’s civil and criminal dockets since 2000. This week, we’ll conclude this issue, beginning with a look at the years 2010-2012.

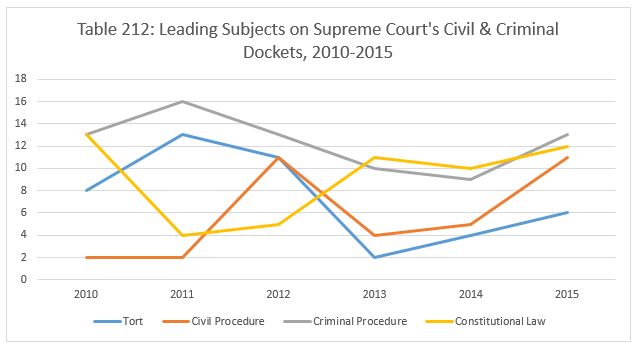
We begin with the year-by-year figures for the two leading subjects on each side of the docket. For the years 2000 through 2004, tort and government and administrative law led the civil docket. The leading subjects on the criminal docket were habeas corpus and criminal procedure cases. Tort and civil procedure led the way on the civil side for 2005 through 2009, and criminal procedure and constitutional law were the leading subjects on the criminal side.

Tort and civil procedure have dominated the civil docket during the past six years. Tort law rose to a high in 2011, before dropping off in the years since. Civil procedure has followed the opposite course; it was a minimal part of the Court’s docket in 2010 and 2011 before reaching a high in 2012, and again in 2015. Criminal procedure has dominated the criminal docket throughout this six-year period. Constitutional law fell sharply from 2010 to 2011 and 2012, before recovering all that ground in the years since.

Table 212

The data for the civil docket in 2010, measured as a fraction of the docket, is reported below in Table 213. Tort law comprised 24.24% of the docket that year. The Court heard four insurance law cases, or 12.12% of the docket. The Court heard three cases each in tax law and constitutional law (9.09%), and two cases each in government/administrative law, civil procedure and domestic relations. The Court heard one case apiece in contract, property law, workers’ compensation, election law, secured transactions, arbitration, consumer law, public employee pensions and trust law, collectively accounting for the final 27.27% of the docket.

Table 213

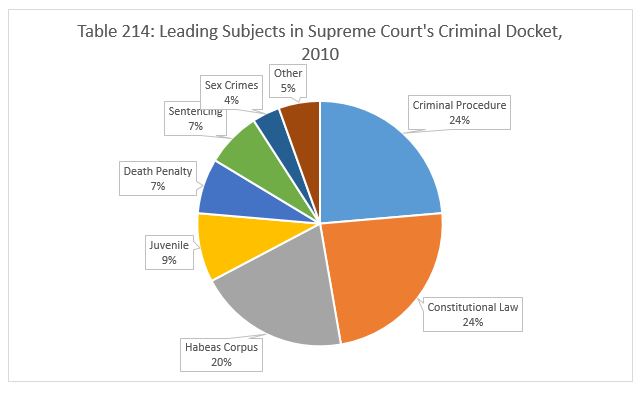
Criminal procedure and constitutional law accounted for 23.21% (apiece) of the criminal docket in 2010. The Court decided eleven habeas corpus cases (19.64%), and five cases involving juvenile issues (8.93%). The death penalty docket had dropped by this time to only four cases (7.14%), and the Court heard four sentencing cases as well. The Court decided two cases involving sex crimes (3.57%) and one each in violent crimes, mental health issues and official misconduct.

Table 214

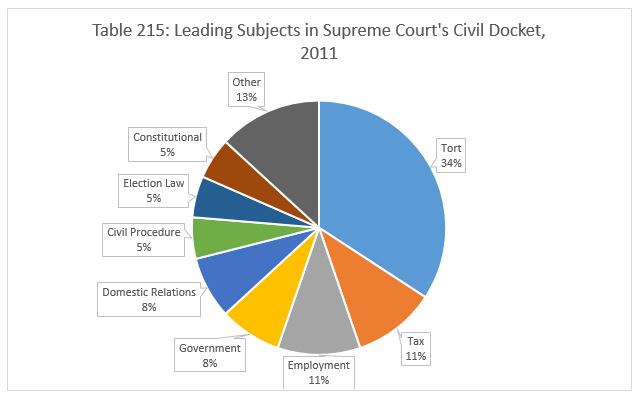
We report the data for the Court’s civil docket in 2011 in Table 215. Tort law was up significantly as a fraction of the Court’s docket – the Court heard 13 tort cases, or 34.21% of the caseload. Only one year after insurance was the second most popular area on the docket, the Court heard only one insurance case in 2011. Instead, the Court heard four cases each – 10.53% of the docket apiece – in tax and employment law. The Court heard three cases involving government and administrative law and domestic relations (7.89%), and two each in civil procedure, election law and constitutional law (5.26%). In addition to the one insurance law case, the Court also heard one case each in environmental, secured transactions, arbitration law and public employee pensions.

Table 215

Criminal procedure was up in 2011 as a fraction of the Court’s criminal docket, amounting to one-third of the total caseload. Sentencing law was way up as well, with the Court’s docket going from four cases in 2010 to 13 in 2011 (27.08%). The Court heard four cases each involving juvenile issues and constitutional law (8.33%), three involving property crimes (6.25%), and two involving habeas corpus and sex crimes (4.17%). Finally, the Court heard one case each involving attorney admission and fitness, the death penalty, drug crimes and obstruction of justice, collectively accounting for 8.33% of the criminal docket.

Table 216

We report the civil docket data for 2012 in Table 217 below. Tort was up slightly – 11 cases, accounting for 27.5% of the docket. Civil procedure was up sharply, tying tort law as the leading subject on the docket with 11 cases. The Court decided four domestic relations cases, or 10% of the civil docket, 3 government and administrative law cases (7.5%), and two each involving election law, constitutional law and public employee pensions (5% apiece). The rest of the docket was widely scattered, with the Court deciding one case apiece in contract, insurance, employment, arbitration and trusts law.

Table 217

In 2012, the Court heard slightly fewer criminal procedure cases (13), but because the overall criminal docket was slightly less, that wound up accounting for a slightly higher fraction of the criminal docket (39.39%). The Court heard only 5 cases involving sentencing issues in 2012, or 15.15% of the criminal docket. The Court also heard five cases each involving constitutional law and sex crimes. The Court’s habeas docket, once the leading part of the criminal caseload, accounted for a mere three cases in 2012 – 9.09% of the criminal docket. Finally, the Court decided one case apiece involving attorney admission and fitness and juvenile issues – 3.03% of the docket, respectively.

Table 218

Join us back here tomorrow as we review the past three years on the Court’s civil and criminal dockets.

Image courtesy of Flickr by John Trainor (no changes).

7513076254_9294ce46b2_z

Yesterday, we continued our examination of the Illinois Supreme Court’s civil and criminal dockets, addressing the areas of law on both sides of the docket in 2005 and 2006. Today, we turn to the next three years, 2007-2009.

Tort cases were down slightly in 2007, both as a fraction of the civil docket (19.51%) and in absolute terms (8 cases). Insurance law was up slightly, accounting for 12.2% of the Court’s civil docket. The Court heard four cases each – 9.76% of the civil docket – involving domestic relations and election law issues. The Court decided three cases apiece in tax, civil procedure, workers’ compensation and constitutional law (7.32% of the docket). The Court added two cases involving issues of consumer law. Finally, the Court heard one case each involving contract, environmental law and public employee pensions, accounting for the final 9.76% of the docket.

Table 206

Criminal procedure cases fell significantly in 2007 from the very high level of one year earlier, although they still accounted for a quarter of the criminal docket. The Court heard seven habeas corpus cases, accounting for an additional quarter of the caseload. Constitutional law cases were up, with the Court hearing six cases on the criminal docket, or 21.43%. The Court heard four cases whose principal issue involved sentencing (14.29%), two death penalty appeals (7.14%) and one case each involving property crimes and violent crimes (3.57% apiece).

Table 207

We report the data for the civil docket in 2008 below in Table 208. Tort law accounted for 35.71% of the civil docket. The Court heard six cases in constitutional law (14.29%), four in civil procedure (9.52%), three in contract and domestic relations (7.14% each), and two cases apiece in tax, property, insurance and employment law (4.76% of the civil docket). Finally, the Court heard one case each in the civil docket arising from election law and secured transactions.

Table 208

Constitutional law cases were up significantly in the Court’s criminal docket in 2008, with 16 cases, or 31.37% of the docket. The Court heard 10 cases each – 19.61% of the docket – in criminal procedure and sentencing law. A further seven cases arose from juvenile issues, or 13.73% of the criminal docket. The Court heard four habeas corpus cases (7.84%), and one case each involving the death penalty, property crimes, alcohol offenses and violent crimes.

Table 209

After a one-year spike, tort cases were down to 21.95% of the civil docket in 2009. The rest of the docket was widely dispersed – the Court heard three cases apiece in tax, government and administrative, property, insurance, elections, constitutional and employment law (7.32% each). The Court heard a further two cases each in domestic relations, public employee pensions and trusts law. Finally, the Court heard one case apiece arising from civil procedure, workers’ compensation, secured transactions, wills and estates and consumer law.

Table 210

Criminal procedure cases rose in 2009 to 43.14% of the criminal docket (22 cases). Sentencing law accounted for 15.69%. Constitutional law cases were 9.8% of the docket. Habeas corpus and death penalty appeals were 5.88% each, and 3.92% of the docket involved sex crimes. The rest of the docket was dispersed, with one case each arising from no less than eight different subjects: attorney admission and fitness, property crimes, violent crimes, juvenile offenses, drug crimes, vehicle crimes, mental health issues and pardons.

Table 211

Join us next week as we turn to the final years of our study period, 2010-2015.

Image courtesy of Flickr by Mike Linksvayer (no changes).

6623200451_33c36fe84c_zLast week, we began our review of the principal areas of law from which the Illinois Supreme Court’s civil and criminal dockets have been drawn, addressing the years 2000 through 2004. Today, we continue our investigation with the second five years of our period – 2005 through 2009.

In Table 201 below, we chart the year-by-year number of cases for the leading two subjects on the civil and criminal dockets. Note two changes from the similar chart we ran last week – government and administrative law cases on the civil side and habeas corpus cases on the criminal side have fallen out of the top two spots. For the period, the two leading subjects were tort and civil procedure on the civil docket, and criminal procedure and constitutional law on the criminal docket. Note that tort cases were relatively flat throughout the period, while civil procedure cases drifted down somewhat. Criminal procedure cases were up and down on the docket, reaching highs in 2006 and 2009. Constitutional law cases pulled out of a slight slide in 2008 before returning to its base level in 2009.

Table 201

The data for the 2005 civil docket is reported below in Table 202. The civil docket was quite widely dispersed, with seven different subjects accounting for eight percent or more of the docket. Sixteen and two thirds percent of the docket was tort law cases. Civil procedure matters were another 12.5%, and insurance contributed 10.42%. The Court heard four cases apiece in government and administrative law, workers’ compensation, constitutional law and consumer law – 8.33% each. The Court heard two cases each in contract, secured transactions and public employee pensions law (4.17%). The Court heard one case apiece in tax, property law, environmental and employment law.

Table 202

Turning to the criminal docket, the Court heard 19 constitutional law cases in 2005 – 32.76% of the docket. Another 18.97% of the docket arose involved criminal procedure issues. Habeas corpus cases had fallen to 12.07% of the docket. Juvenile issues accounted for another 10.34%. The Court heard five cases involving sex crimes – 8.62%. Another 5.17% arose from vehicle crimes, and 3.45% each from sentencing issues and drug crimes. The Court heard one case each involving the death penalty, property crimes and the elements of violent crimes.

Table 203

We report the data for the civil docket in 2006 below in Table 204. Tort and civil procedure cases were both up slightly as a fraction of the docket, to 20.41% and 16.33%. Government and administrative law cases were up a bit to 12.24% of the docket; constitutional law was up somewhat (10.2%), and insurance slightly down (8.16%). The Court heard three cases each arising from domestic relations and workers’ compensation, and two apiece in arbitration, wills and estates and consumer law. The Court heard one case each in tax law, secured transactions, employment law and public employee pensions.

Table 204

The Court’s caseload in constitutional law fell by nearly half in 2006, with the Court hearing ten cases, or 19.61% of the docket. On the other hand, the caseload in criminal procedure exactly doubled to 22 cases, or 43.14% of the docket. Sentencing issues accounted for 9.8% of the docket, another 7.84% in juvenile issues, and 5.88% involving violent crimes issues. The Court heard two cases each arising from attorney admission and fitness issues, death penalty, and drug offenses. By 2006, the Court’s caseload in habeas corpus had fallen to only one case.

Table 205

Join us back here tomorrow as we address the Court’s docket for the years 2007 through 2009.

Image courtesy of Flickr by Paul Sableman (no changes).

6950264727_d8e013a78b_zYesterday, we began our review of the Illinois Supreme Court’s civil and criminal dockets, analyzing the primary areas of the law from which the Court’s caseload is drawn. Today, we address the years 2002-2004.

The civil docket data for 2002 is reported in Table 195 below. Tort law was up substantially from 2001 to 2002, now amounting to 34% of the civil docket. Civil procedure cases were up slightly to 16% of the docket. Government and administrative law cases were flat, still amounting to 12% of the docket. Constitutional law was down slightly, amounting to 8% of the civil caseload in 2002. Workers’ compensation and employment law cases were 6% of the docket apiece. Property, insurance and domestic relations cases accounted for 4% of the docket each (2 cases apiece). The Court heard one case each falling in contract law, public employee pensions and trusts, wills and estates.

Table 195

Habeas corpus cases were once again the most common area of the law in the criminal docket in 2002, accounting for 27.14% of the caseload. Constitutional law cases were down slightly, contributing 25.71% of the criminal docket. Criminal procedure cases were once again flat, accounting for 11.43%. Sentencing and juvenile offenses cases were 10% of the docket each. By 2002, death penalty direct appeals had fallen to 7.14% of the criminal docket. Another 2.86% of the docket arose from cases involving the elements of violent crimes. The Court rounded out its docket with one case each involving attorney admission and discipline, drug offenses, sex offenses and mental health issues.

Table 196

In 2003, tort cases were substantially down and government and administrative cases were up, with tort cases falling to 19.57% of the docket, and government and administrative law cases accounting for 21.74%. Civil procedure cases fell slightly to 15.22% of the docket. Domestic relations cases were up to 10.87% of the docket. Constitutional and insurance law cases were up slightly (8.7% and 6.52%, respectively). The Court heard two cases each involving workers’ compensation and public employee pensions (4.35% of the civil docket), and one case each in tax, secured transactions, trusts, wills and estates and consumer law.

Table 197

The data on the criminal docket for 2003 is reported in Table 198 below. Constitutional law cases were up sharply, amounting to 38.46% of the criminal docket. Criminal procedure cases were up substantially as well, contributing 21.54% of the caseload. Juvenile offense cases were flat, accounting for 10.77%. Habeas corpus cases fell by nearly three quarters as a fraction of the overall criminal docket, accounting for only 7.69%. Sentencing law cases were down slightly to 7.69%, and the decline of death penalty appeals continued (4.62%). The Court heard two cases involving sex offenses and one case each involving attorney admission and discipline, violent crimes, drug crimes and mental health issues.

Table 198

In 2004, tort cases were up slightly and government and administrative law cases were down substantially as a fraction of the criminal docket (22.22% and 12.96%, respectively). Constitutional law cases also comprised another 12.96% of the docket. Domestic relations cases were up slightly to 11.11% of the criminal docket. Civil procedure was down significantly to 7.41% of the caseload, and insurance was down slightly to 5.56%. The Court heard an additional two cases each in contract, tax, workers’ compensation, arbitration and trusts, wills & estates law. Finally, the Court heard one case each falling under property, election, environmental, consumer and public pensions law.

Table 199

Finally, we turn to the criminal docket in 2004. Constitutional law fell significantly as a fraction of the docket, accounting for 24.56% of the caseload. Criminal procedure produced 22.81% of the docket. Habeas cases were up slightly, contributing 12.28% of the docket. Juvenile offenses and sex crimes accounted for 8.77% of the docket each, and sentencing law a further 7.02%. Cases involving the elements of violent crimes were 5.26% of the caseload. By 2004, death penalty appeals had fallen to 3.51% of the criminal docket, and mental health issues accounted for another 3.51%. Attorney admission and discipline and administrative offenses contributed one each case – 1.75% of the criminal docket apiece.

Table 200

Join us back here next week as we look at the Court’s civil and criminal dockets between 2005 and 2009.

Image courtesy of Flickr by Brad Clinesmith (no changes).


6974951957_3f32facc9e_z

Last week, we finished comparing where in the state the Supreme Court’s civil and criminal dockets have been drawn from between 2000 and 2015. Today, we begin a new subject, comparing the two dockets by the area of law involved.

In Table 190 below, we report the data for the two leading areas of law in both the civil and criminal dockets. Several things are noteworthy about this chart. First, although tort is nearly always the biggest single share of the Court’s civil docket, the number of tort cases does move up and down substantially from one year to the next. The second most common civil area, government and administrative law, produces a more consistent number of cases from one year to the next. Habeas corpus cases dominated the criminal docket at the outset of this period, but dropped sharply over the five years. Constitutional law was steadier, with the number of cases slowly rising from 2000 to 2003 before dipping in 2004.

Table 190

We report the composition of the civil docket in 2000 below, in Table 191. As suggested by the Table above, tort was the single biggest portion of the docket, accounting for 28.95% of the Court’s civil cases. Government and administrative cases were 13.16% of the docket, followed by civil procedure and workers’ compensation with 10.53% of the docket apiece. After that, insurance and domestic relations contributed 7.89% of the civil docket each. Contract and tax law were 5.26% of the docket each. The rest of the civil docket was scattered, with the Court hearing one case each in property, election, environmental and constitutional law.

Table 191

In 2000, almost exactly one-third of the Court’s criminal docket involved habeas corpus claims. Just short of 20% were death penalty appeals, and another 16.28% were constitutional law cases. Criminal procedure cases accounted for 8.14% of the caseload, with another 4.65% each contributed by both sentencing cases and attorney admission and fitness matters. Violent crimes and juvenile offenses accounted for 3.49% of the docket each; the Court heard two cases each involving property crimes and sex offenses, and one involving drug offenses.

Table 192

Tort cases fell to 17.65% of the civil docket in 2001. Civil procedure and government/administrative law cases stayed more or less static as a share of the civil docket at 13.73% and 11.76%, respectively. Insurance and domestic relations cases accounted for 7.89% of the docket each, followed by contract and tax law, which contributed 5.26% each. The rest of the civil docket was made up of one case each in four different fields – property, election, environmental and constitutional law.

Table 193

We report the data for the criminal docket in 2001 in Table 194 below. Constitutional law cases were substantially up in 2001 to 28.81% of the docket. Habeas corpus cases were down, amounting to 22.03% of the criminal docket. Death penalty appeals and criminal procedure cases accounted for 11.86% of the docket each. Juvenile offenses and sentencing cases were flat, remaining at 10.17% and 8.47% of the criminal docket, respectively. The Court heard two cases involving sex crimes, or 3.39% of the docket, and one case each involving violent crimes and vehicle crimes.

Table 194

Join us back here tomorrow as we turn to the Court’s civil and criminal dockets between 2002 and 2004.

Image courtesy of Flickr by Nicolas Henderson (no changes).

3359239271_c94b0e675d_zYesterday, we continued our review of the geographic origins of the Illinois Supreme Court’s docket with a look at the Court’s civil and criminal caseload in the years 2010-2012. Today, we conclude our analysis with a look at the past three years, 2013-2015.

The Court’s civil docket from Cook County dropped from 19 cases in 2012 to 13 in 2013 – 39.39% of the docket. The Court heard four cases from Sangamon County, or 12.12% of the civil docket. DuPage and LaSalle counties contributed two cases apiece in 2013 (6.06% each). The rest of the Court’s civil docket was widely distributed, with a dozen counties contributing one case each: Lake, Kane, McHenry, Will, Macoupin, Woodford, Effingham, Vermilion, LaSalle, Piatt and Stephenson counties, the Pollution Control Board and the Educational Labor Relations Board.

Table 184

We report the data on the Supreme Court’s criminal docket for 2013 in Table 185 below. The Court heard 21 cases from Cook County Circuit Court, or 55.26% of the docket. Three cases each arose from Lake and Morgan counties, or 7.89% each of the criminal docket. The Court heard two cases from Peoria County, or 5.26% of the docket. The remainder of the docket was distributed among nine jurisdictions – Winnebago, Kane, Adams, Champaign, McLean, Jackson, Livingston, Clinton counties and the ARDC Review Board.

Table 185

In 2014, Cook County’s share of the civil docket increased from 39.39% to exactly half. The Court heard three cases from Sangamon County – once again, the second leading source of civil cases at 11.54% of the docket. Two cases each arose from Lake and Macoupin counties – 7.69% of the docket. The rest of the civil docket was spread among only six jurisdictions: Kane, Franklin, Kendall, Washington and Marion counties and the Illinois Commerce Commission.

Table 186

Cook County’s share of the criminal docket dropped in 2014 as the Court heard only 11 cases – 32.35% of the criminal docket. Kane County contributed three criminal cases to the docket (8.82%). McLean and Randolph counties and the ARDC Review Board were responsible for two cases each. The rest of the docket was widely distributed with fourteen jurisdictions accounting for one case apiece – Lake, St. Clair, DuPage, Champaign, Livingston, Marion, Vermilion, Peoria, Whiteside, Macon, Stark, Kendall, McDonough and Perry counties, for a collective 41.16% of the docket.

Table 187

Cook County’s share of the civil docket fell to 37.78% in 2015. Four cases arose from Lake County, accounting for 8.89%. Champaign County produced three cases, St. Clair, Sangamon, Will and Peoria counties two each. Once again, the low end of the docket was widely dispersed, with thirteen jurisdictions producing one case apiece – Winnebago, McHenry, DuPage, Madison, Macon, McLean, Jefferson, Jackson, Stephenson, Warren and Saline counties, the Commerce Commission and the Educational Labor Relations Board.

Table 188

The Cook County caseload was up on the criminal side in 2015, with the Court hearing 16 cases originating there (48.48% of the criminal docket). The Court heard four criminal cases from Will County and three from Kane County. The Court heard one case each from ten different counties – St. Clair, Sangamon, DuPage, Adams, McLean, Jefferson, Peoria, Rock Island, Macoupin and DeKalb counties – collectively accounting for the final 30.3% of the docket.

Table 189

Next week, we’ll begin tracing the areas of law the Court has addressed in its civil and criminal dockets over the past sixteen years.

Image courtesy of Flickr by Katherine Johnson (no changes).

17257646452_bdf0b881b8_zLast week, we compared the geographical sources of the Illinois Supreme Court’s civil and criminal dockets during the years 2005-2009. Today, we begin our examination of the following six years of our period of study, 2010-2016.

Two-thirds of the civil docket in 2010 arose from Cook County – 22 cases in all. Kane and Sangamon counties originated two cases apiece – 6.06% of the civil docket each. Seven additional jurisdictions – St. Clair, Will, Tazewell, Champaign, Jefferson, LaSalle and Marion counties – produced one case each, collectively accounting for the final 21.21% of the civil docket.

Table 178

In contrast, Cook County accounted for 41.82% of the criminal docket in 2010 – 23 cases. Peoria County accounted for six cases, or 10.91% of the criminal docket. DuPage County produced 4 cases, for 7.27% of the docket, Kane County three cases (5.45%), and Lane, Winnebago and Boone counties two cases apiece (3.63%). The rest of the criminal docket was widely spread geographically, with thirteen jurisdictions accounting for one case each – Will, Kankakee, La Salle, Livingston, Hancock, Macoupin, Morgan, Macon, Tazewell, Clinton, Fayette, Knox and Jersey counties.

Table 179

The Court’s civil docket from Cook County fell to only fifteen cases in 2011, accounting for 39.47% of the docket. Lake and DuPage counties accounted for four cases each, or 10.53% of the civil docket. Sangamon County originated three cases in 2011, or 7.89% of the civil docket. Will and Madison counties contributed two cases each to the docket (5.26%). Eight additional jurisdictions – Winnebago, Kane, Jefferson, Williamson and Peoria counties, the Pollution Control Board, the Educational Labor Relations Board and the Seventh Circuit (on certification) — accounted for one case apiece, or 21.06% of the civil docket.

Table 180

The Court heard twenty-six criminal cases from Cook County in 2011, and Cook’s share of the docket accordingly increased to 54.17%. DuPage County produced four criminal cases, for 8.33% of the criminal docket. Peoria County accounted for three cases, or 6.25% of the docket. Lake, Will and Champaign produced two cases each (4.17%). Once again, the criminal docket was widely dispersed, with nine jurisdictions producing one case apiece – St. Clair, Kane, Adams, McLean, Livingston, Macon, Boone and Schuyler counties, and the ARDC Review Board.

Table 181

Cook County’s share of the civil docket increased in 2012, with the Court hearing nineteen cases from the Cook County Circuit Court, or 46.34% of the civil docket. Three cases each came from St. Clair, DuPage and Champaign counties (7.32% of the docket), and two cases from Will County (4.88%). Eleven originated one case apiece – Lake, Kane, Sangamon, Kendall, Madison, Massac, Putnam, Lee, Marion and Clinton counties, and certification cases from the Seventh Circuit.

Table 182

The Court’s docket of criminal cases from Cook County dropped significantly in 2012, with the Court hearing 13 criminal cases, or 39.39% of the docket. The Court heard five cases from Will County, or 15.15% of the docket. Three cases arose from Peoria County, for 9.09% of the criminal docket, and two from Lake County – 6.06% of the docket. Eleven different jurisdictions accounted for one case each – Adams, Champaign, Kankakee, LaSalle, Coles, Peoria, Stephenson, Rock Island, Morgan and Ford counties, and the ARDC Review Board.

Table 183

Join us back here tomorrow as we turn to the final three years of our study period – 2013-2015.

Image courtesy of Flickr by Jeff Sharp (no changes).

5989414114_995a0a4dc6

Originally published on Law360, Feb. 3, 2016. Posted with permission.

For the past three years, we’ve taken a close statistical look at the previous year’s decisions from the Illinois Supreme Court to see what insights could be gained about the justices’ voting patterns and decision making dynamics. (View the 2012 analysis here, 2013 analysis here and 2014 analysis here.) In 2015, the centrist justices were once again in the majority in most civil and criminal cases. Meanwhile, the court maintained its extraordinarily high rate of unanimity, while significantly decreasing the lag time between arguments and decisions.

For 2015, the court decided 44 civil cases, plus an additional 33 criminal and quasi-criminal, attorney discipline and juvenile cases. Only 56.8 percent of the court’s civil docket arose from final judgments of the trial courts — a sharp decline from 2014, and somewhat below the court’s long-term trends. Final judgments have historically been a smaller part of the court’s criminal docket than they are on the civil side, and 2015 was no exception — 42.4 percent of the court’s criminal and quasi-criminal docket was drawn from final judgments of the trial courts. Cook County Circuit Court was the source of 38.64 percent of the court’s civil cases — a slight decrease from 2014 — with suburban Lake County ranking second at 9.09 percent. On the criminal side of the docket, Cook County Circuit Court originated 48.48 percent of the cases decided, with nearby Will County second at 12.12 percent.

On the civil side, the court decided 11 cases involving civil procedure issues, eight arising from government and administrative law, six in tort and four each in domestic relations and constitutional law. The court remained skeptical of plaintiffs’ claims in tort; all six tort cases it decided had been won by the plaintiffs below, and the court ultimately reversed in five of six. Similarly, all of the constitutional law cases accepted by the court had been won by the plaintiffs below, and the court reversed in every one. On the criminal side of the docket, the court decided 12 cases apiece in criminal procedure and constitutional law and five involving sentencing issues. The court reversed in four of the five criminal procedure cases won by the defendants below and in nine of the 10 constitutional law cases where the defendant had prevailed.

The portion of the court’s civil docket involving dissents at the Appellate Court level increased substantially to 34.1 percent in 2015, moving much closer to its long-term trend. The percentage for the criminal docket was almost identical — exactly one-third of the docket arose from fractured Appellate Court cases. Although these numbers were up in 2015, the fact remains that the often-heard anecdotal claim that the court doesn’t hear unanimous decisions from the Appellate Courts is simply untrue. 20.45 percent of the court’s civil docket arose from unpublished Rule 23 orders — a significant decrease from 2014. In contrast, 42.4 percent of the court’s criminal docket arose from unpublished opinions (a 10-point increase from 2014).

We reported last year that the court’s unanimity rate in civil cases had returned to its long-term trend in 2014 after a two-year dip, with the court deciding three-quarters of its cases unanimously. The unanimity rate was almost identical this year, with the court deciding 79.5 percent of its civil cases unanimously. If one adds the 6-1 decisions to the unanimous ones, we find that 88.6 percent of the court’s civil decisions were decided by lopsided margins. The experience on the criminal side was quite similar — 81.8 percent of decisions were unanimous, and 87.9 percent were lopsided.

The court substantially improved its lag time from argument to decision this past year in cases where the court was divided. Average time under submission for non-unanimous decisions on the civil docket was 152.6 days, a 21.2 percent decrease over the previous year. Non-unanimous criminal cases were under submission for an average of 159.6 days — an improvement of 14.2 percent over 2014. Days under submission were essentially static for unanimous decisions — 104.8 days for civil cases (a slight increase from 2014) and 120.5 days for criminal cases. Measured from the date cases began — whether by allowance of a petition for leave to appeal or filing of a notice of direct appeal — the court continued to move its docket reasonably quickly. Unanimous civil cases were before the Court for an average of 281.3 days from allowance to decision, a slight improvement from 2014, and 367 days for non-unanimous civil cases. Criminal cases were pending for slightly longer. Unanimously decided criminal cases were pending for an average of 420.5 days from grant to decision, while non-unanimous criminal cases were pending an average of 358.3 days.

The court’s reversal rate in civil cases fell sharply from a high of 77.8 percent in 2014 back down to a level more in line with its historical trend since 2000 — 54.5 percent. The court’s reversal rate in criminal cases was much higher at 69.7 percent (a hefty increase from 2014, when the court reversed in only 42.4 percent of criminal cases it decided).

Although Chicago’s First District always contributes a significant portion of the court’s civil docket, the First’s share was down somewhat in 2015, falling from 48.1 percent in 2014 to 36.4 percent in 2015. Fifty percent of First District decisions reviewed on the civil docket were reversed. Factoring in the rare direct appeals from circuit courts, 38.6 percent of the court’s civil docket arose from Cook County. The second biggest contributor to the civil docket was the Second District with 18.2 percent of the caseload. The Second District was reversed in 37.5 percent of those cases. The Fifth District contributed 13.6 percent of the court’s civil docket, and was reversed 83 percent of the time (a reversal rate consistent with that district’s recent record).

The criminal docket was similar — the First District contributed 39.4 percent of the criminal docket, with exactly 50 percent of the court’s cases originating in Cook County. The First District was reversed in criminal cases just over half the time — 53.8 percent. The Third District contributed 18 percent of the criminal docket and was reversed half the time, and the court decided five cases on direct appeals, reversing in whole or in part in every one. While the court heard only a few cases from the Second and Fourth Districts (three and four cases, respectively), the court reversed each of those decisions in whole or in part as well.

Justice Lloyd A. Karmeier led the court in civil decisions with nine majority opinions this past year, including the centerpiece of the year, the court’s eloquent unanimous opinion striking down the legislature’s public pension reform bill in the Pension Reform Litigation. Justices Mary Jane Theis, Robert R. Thomas and Charles E. Freeman were next with seven majorities each, followed by Justice Anne B. Burke (who led last year in civil majorities) with six.

Justice Thomas led the court in majority opinions on the criminal side with six. Justices Theis, Thomas L. Kilbride and Anne M. Burke were next, writing five majority opinions each in criminal cases. The remaining justices — Chief Justice Rita B. Garman, and Justices Freeman and Karmeier — wrote four majorities each in criminal cases.

Dissents were once again comparatively rare on the Court. Justice Kilbride led on the civil side, writing four dissents. Justice Burke wrote three and Justice Freeman two. On the criminal side, there was a five-way tie — with everyone but Justices Karmeier and Theis dissenting once.

As we noted last year, one way of understanding the court’s dynamics is to track which justices are most often in the majority when the court is divided. In 2014 Justices Thomas and Karmeier voted with the majority in every one of the court’s civil cases. This past year, the chief justice was in the majority in every one of the court’s nine split decisions on the civil docket. Justice Thomas voted with the majority in each of the seven split cases in which he participated. Justice Theis was in the majority in eight of nine split civil cases, with Justice Karmeier right behind, voting with the majority in seven of nine. Justices Freeman and Kilbride were least often in the majority, voting with the majority in five and three of the nine non-unanimous decisions, respectively. On the criminal side, the chief justice and Justices Thomas, Karmeier and Theis all voted with the majority in five of six non-unanimous cases. Justices Burke and Freeman were most often at odds with the court in such cases, voting with the majority only half the time.

Agreement rates among the three Republican justices — Chief Justice Garman and Justices Thomas and Karmeier — dipped slightly in 2015 from their recent trend. Although the chief justice agreed with Justice Thomas in every one of the non-unanimous civil cases, Justices Thomas and Karmeier agreed in only 71.4 percent of non-unanimous civil cases, and Justice Karmeier and the Chief Justice agreed 77.8 percent of the time. On the other hand, Justices Burke and Karmeier voted the same way in 88.8 percent of all non-unanimous civil cases. The chief justice and Justice Theis voted together just as often — 88.8 percent of non-unanimous cases. Justices Thomas and Theis voted the same way in 85.7 percent of non-unanimous civil cases. Among the lower agreement rates in non-unanimous civil cases were Justices Burke and Kilbride (0 percent); Chief Justice Garman and Justice Kilbride (33.3 percent); Justices Kilbride and Karmeier (11.1 percent) and Justices Kilbride and Thomas (22.2 percent).

Voting dynamics are more unpredictable in the court’s criminal docket than they are on the civil side. Only two combinations of justices voted together even four-fifths of the time in criminal cases in 2015 — Justices Burke and Freeman (100 percent) and Thomas and Karmeier (100 percent). Several different combinations of the justices have agreement rates in non-unanimous cases of two-thirds, including the chief justice and Justices Thomas, Karmeier and Theis, and Justices Burke, Freeman, Thomas and Karmeier (respectively) and Justice Theis. Justice Kilbride’s agreement rate is exactly 50 percent with each of the other six justices. Several more combinations of justices agreed in only one-third of all non-unanimous criminal cases: the chief justice and Justices Burke and Freeman; Justice Burke and Justices Thomas and Karmeier; and Justice Freeman and Justices Thomas and Karmeier.

The court asked 839 questions during arguments of civil cases decided during 2015 — 441 to appellants (an average of 10.02 per argument), 398 to appellees (an average of 9.05 per argument). Justice Thomas led the court with 300 questions, with Justice Theis (150) and the chief justice (113) next. After that came Justice Karmeier (93), Justice Kilbride (83), and Justice Burke with 73 questions. Justice Freeman was the least active justice on the civil side, with 27 questions.

I’ve heard a number of specialists in criminal appellate law suggest that the Illinois Supreme Court is a less “hot” bench during oral argument of criminal cases than it is in civil cases. That was only partially true in 2015. The court asked 566 questions during arguments of criminal cases decided during 2015 — 349 to appellants (an average of 10.9 per argument) and 217 to appellees (an average of 6.8 per argument). So although the court asked significantly fewer questions of appellees in criminal cases — more often than not, the state — it asked slightly more questions of appellants. Justice Thomas was the most active questioner on the criminal side (185), with Justice Theis second (118) and the chief justice (91) third. But after that, the order was somewhat different, with Justice Karmeier (77), Justice Burke (71), and Justices Freeman (15) and Kilbride (9).

Whether or not the court was split in its view of a case appeared to have little impact in 2015 on the intensity of the questioning. The court averaged slightly more questions to appellants in non-unanimous civil decisions — 9.56 to 10.38 — but slightly fewer questions to appellees — 10.11 to 9.85. No impact was evident on the criminal side of the docket either. Indeed, appellants were asked more questions in cases decided unanimously: 10 in non-unanimous decisions, 11.04 in unanimous ones. The result was similar for appellees: five in non-unanimous decisions, 7.19 in unanimous ones.

The most active cases on the civil side were Seymour v. Collins, with 42 questions asked of both sides combined. The most actively questioned appellant was in Gurba v. Community High School District No. 155, with 25. The most actively questioned appellee was in Seymour with 28. On the criminal side, the most active court was in People v. Fiveash and People v. Smith, with 33 questions each. The most heavily questioned appellant was in People v. Fiveash, with 22, and the most heavily questioned appellee was in People v. Smith at 18.

Scholars who have investigated whether the intensity of questioning signals the result have all concluded that all things being equal, the most heavily questioned side is far more likely to lose. We came to the same conclusion this year on the Illinois Supreme Court review, based upon a study of all 233 arguments in civil cases at the court between 2008 and 2014. The numbers in 2015 reflect the same trend.

The four most heavily questioned parties — the appellants in Gurba and Fiveash and the appellees in Seymour and Smith — all lost. For the docket as a whole, on the civil side, losing appellants averaged 12.8 questions per argument to 6.65 for winning appellants. Losing appellees averaged 12.48 questions per argument to 6.05 for winning appellees. Appellants who received more questions than their opponents lost 15 of 21 cases. Appellees who received more questions lost 17 of 22 cases. On the criminal side, losing appellants averaged 12.6 questions per argument to 10.05 for winning appellants. Losing appellees averaged 8.18 questions per argument to only 3.7 for winning appellees. Appellees in criminal cases received more questions than their opponents in eight cases in 2015, and lost all eight. The pattern was broken only with criminal appellants, who won 14 of 23 criminal cases where they received more questions than their opponents.

In 2014, six of the seven justices averaged more questions to appellants in civil cases than to appellees. This past year, questioning was more evenly distributed. Justices Burke (1.43/0.54), Freeman (0.41/0.20), Theis (2.27/1.14) and, by a slight margin, Justice Kilbride (0.98/0.91) averaged more questions to appellants than appellees. Chief Justice Garman (1.61/0.95) and Justices Thomas (3.64/3.33) and Karmeier (1.09/1.02) averaged more questions to appellees. The court’s record in arguments in criminal cases was quite different, however: All seven justices averaged more questions to appellants.

Dividing the arguments into cases decided unanimously and non-unanimously reveals interesting patterns. All seven justices averaged more questions to appellees in civil cases decided unanimously than in non-unanimous decisions. On the other hand, five of the seven justices — Chief Justice Garman and Justices Burke, Freeman, Kilbride and Theis — averaged more questions to appellants in cases decided by a divided court. Once again, arguments in criminal cases were quite different. The chief justice and Justices Burke and Thomas asked more questions of appellees in unanimous decisions and of appellants in non-unanimous ones — the same pattern a majority of the court followed in civil cases. But Justices Freeman, Kilbride and Karmeier averaged more questions to both sides when the court was unanimous than when the court was divided. Justice Theis averaged more questions to appellants in unanimous cases, but to appellees in non-unanimous ones.

Finally, we considered what one could infer about what a justice might do in a particular case from watching oral argument. Because of the court’s high unanimity rate, it is difficult to say anything definitive about whether justices are more influenced by their own vote or by the views of the majority of the court in deciding which side to more heavily question based solely on 2015. One can easily imagine a justice checking his or her own conclusions by more closely questioning the party the justice was voting against, regardless of the majority view, or perhaps justices in the minority use oral argument to press the party the majority of their colleagues favor in an attempt to convert additional votes.

In civil case affirmances, Justices Burke and Kilbride both averaged more questions to the appellant when they dissented — in other words, the party the justices voted for. Similarly, Justices Burke (4.5/0), Freeman (1.0/0), Thomas (6.0/0) and Karmeier (1.0/0) both averaged more questions to the appellant when they dissented from an affirmance.

Our study of the larger database of arguments between 2008 and 2014 concluded that nearly all of the justices tend to be more active in oral argument in cases where they write the majority opinion. That pattern held true in 2015. When the court reversed, six of the seven justices averaged more questions to the appellee than in reversals where they were not writing (the lone exception being Chief Justice Garman). Five of the seven justices averaged more questions to the appellant when they were writing for the court in a reversal (the exceptions: Justices Freeman and Kilbride).

Curiously, writing appeared to have much less of an impact in criminal cases. While four justices — the Chief Justice and Justices Thomas, Karmeier and Theis — averaged more questions to appellants when they wrote the majority opinion in a reversal than when they did not, only three justices — Burke, Thomas and Karmeier — averaged more questions to appellees in reversals when they wrote the opinion.

Our review of the Illinois Supreme Court’s year suggests several lessons for counsel: (1) the court continues to decide a very high fraction of its cases unanimously; (2) the court is quite skeptical of plaintiffs’ wins in tort and constitutional law; (3) a dissent at the Appellate Court is not an essential prerequisite to persuading the court to review a decision; (4) the length of time a case is under submission following oral argument is a fairly reliable predictor of dissent; (5) in the relatively rare cases when the court is divided, the justices most likely to be in the majority are the chief justice, Justices Karmeier and Thomas, with Justices Theis and/or Burke providing the deciding votes; and (6) a party receiving substantially more questions at oral argument is more likely to lose.

Image courtesy of Flickr by Jim Bowen (no changes).

7513084232_c70f27070c_zYesterday, we reviewed the originating counties for the Illinois Supreme Court’s civil and criminal dockets for the years 2005-2007. Today, we turn to the years 2008 and 2009.

The data for the civil docket in 2008 is reported below in Table 174. Cook County’s share of the civil docket fell in 2008 to 38.1% of the docket – slightly below its long-term trend level. The Court heard four civil cases each from Lake, Sangamon and Du Page counties – 9.52% of the civil docket apiece. Will (another of the large northern counties near Chicago) accounted for 7.14% of the docket. Eleven jurisdictions – St. Clair, Kane, Adams, Madison, Macon, Champaign, McLean, Peoria and Greene counties, the Illinois Commerce Commission and the Illinois Labor Relations Board – produced one case each, or 26.19% of the civil docket.

Table 174

We review the data for the criminal docket in 2008 in Table 175 below. Cook County returned to its long-term trend, accounting for 36.54% of the criminal docket. Will County accounted for five cases, or 9.62% of the criminal docket. Four cases each came from Du Page and Peoria counties, and two each from Lake, Winnebago, Champaign, McLean and Grundy counties. Ten additional jurisdictions – Kane, McHenry, Adams, Livingston, Bureau, Rock Island, Tazewell, Woodford, Greene and Kendall counties – originated one case each, accounting for the final 19.23% of the Court’s criminal docket.

Table 175

The data for the 2009 civil docket is shown in Table 176 below. The caseload from Cook County fell somewhat to 31.58% of the docket. The Court heard five civil cases from Du Page County – 13.16% of the civil docket – and four from Will County (10.53%). Three cases each arose from Lake and St. Clair counties. Eleven different jurisdictions contributed one case each to the civil docket – Winnebago, Sangamon, Williamson, Edgar, Vermilion, Cumberland, Marion, Grundy and Clinton counties, the Illinois Human Rights Commission and the Board of Elections – for a collective 28.95% of the civil docket.

Table 176

Criminal cases from Cook County were at their highest level in the five year period in 2009, both in absolute terms and as a fraction of the overall docket, with the Court hearing 28 cases, or 54.9% of the docket. Du Page and Will counties originated four cases each. The remainder of the docket was widely scattered, with fifteen different jurisdictions contributing one case each: Lake, Winnebago, Sangamon, Adams, Champaign, McLean, Kankakee, Livingston, Iroquois, Vermilion, Peoria, De Kalb, Kendall and Clark counties, and the ARDC Review Board.

Table 177

Join us back here next Tuesday as we address the geographical sources of the Court’s docket from 2010 through 2015.

Image courtesy of Flickr by Mike Linksvayer (no changes).

7507995376_608682b2bb_zLast week, we began reviewing where the Illinois Supreme Court’s civil and criminal dockets originated from during the first five years of our study period (2000-2004). Today and tomorrow, we review the second five years of the period.

The data for the civil docket in 2005 is reported in Table 168 below. Cook County’s share of the civil docket increased by ten points from 2004 to 2005 to 53.19%. Franklin and Madison counties increased to 8.33% of the civil docket apiece. Lake County was down slightly to 4.17% of the civil docket. Sangamon County, which had produced only one case the previous year, accounted for another 4.17% of the docket. Eleven additional jurisdictions – St. Clair, Kane, McHenry, Du Page, Peoria, Rock Island, Vermilion, Williamson, Henry and Ogle counties, and the Illinois Labor Relations Board – produced one case each.

Table 168

The Court heard 21 cases from Cook County on the criminal docket in 2005 – 36.21% of the caseload. Du Page County, which accounted for only one case on the civil docket, produced six cases on the criminal docket, or 10.34% of the caseload. The Court heard three criminal cases each from Will, Champaign and Macon counties – 5.17% of the docket apiece. Kane, Kankakee and Grundy counties produced two cases each, or 3.44% of the criminal docket. Finally, sixteen different jurisdictions – Winnebago, St. Clair, Sangamon, McHenry, Adams, Madison, Douglas, Vermilion, Coles, Rock Island, Henry, Ogle, Warren, Clinton, Saline and Boone counties – accounted for one case apiece, or 22.92% of the criminal docket collectively.

Table 169

The data for the civil docket in 2006 is reported in Table 170 below. The Court heard 20 civil cases from Cook County, but with the Court’s total civil caseload down slightly, this amounted to 42.86% of the Court’s docket. The Court heard three cases each – 6.12% of the docket – from Lake, St. Clair, Sangamon and McHenry counties. The Court decided two cases from Rock Island County, accounting for 4.08% of the docket. The lower end of the Court’s civil docket was widely dispersed, with fourteen different counties accounting for one case each, or 28.57% of the docket – Winnebago, Kane, Du Page, Kendall, Madison, McLean, Jefferson, Jackson, Peoria, Coles, Scott, Perry, La Salle and Menard counties.

Table 170

Cook County’s share of the criminal docket increased slightly to 39.22% of the docket in 2006. Kane and Will counties both increased their share to 7.84% of the criminal docket apiece. The Court heard two cases each – 3.92% of the criminal docket – from Lake, Champaign and Marion counties and the ARDC Review Board. Finally, the Court heard one case each from fifteen different jurisdictions – St. Clair, Sangamon, Du Page, McLean, Jefferson, La Salle, Pike, Vermilion, Ogle, Tazewell, Williamson, Boone, Stark, Moultrie and Ford counties – amounting to the final 29.41% of the criminal docket.

Table 171

In 2007, Cook County’s share of the civil docket increased substantially to 51.22%. The Court heard two cases each from Lake, Sangamon and Will counties, or 4.88% of the docket each. Another fourteen jurisdictions produced one case each for a collective 34.15% of the docket – Winnebago, Du Page, Madison, Tazewell, Peoria, Knox, Rock Island, Pike, Piatt, Lee and Montgomery counties, and three administrative agencies – the Pollution Control Board, the Labor Relations Board and the Property Tax Appeals Board.

Table 172

That same year, Cook County’s share of the criminal docket increased significantly to 53.57%. Only two other counties produced multiple criminal cases on the Court’s docket – Du Page and Peoria with two cases each. The docket was far more concentrated in 2007, with nine jurisdictions producing one case each – Winnebago, Kane, Adams, Champaign, Livingston, De Kalb, Macon, Tazewell and Union counties.

Table 173

Join us back here tomorrow as we address the years 2008 and 2009.

Image courtesy of Flickr by Teemu008 (no changes).