26675009366_4b5cb1090b_z

Yesterday, we discussed the distribution of majority opinions in civil cases at the Illinois Supreme Court between 2005 and 2009.  Today, we turn to the distribution of majorities in criminal cases during the same years.

For 2005, non-unanimous majorities in criminal cases were evenly spread among the Justices, with Chief Justice McMorrow and Justices Garman, Kilbride and Fitzgerald writing two each.  Justices Thomas and Karmeier wrote one apiece.  In 2006, Justice Garman led the Court with five non-unanimous majorities in criminal cases.  Justice Fitzgerald wrote three majorities, Justice Karmeier two, and Chief Justice Thomas and Justices Kilbride, Freeman and McMorrow wrote one each.  For 2007, Justice Freeman led the Court with three majority opinions in non-unanimous criminal cases.  Justice Fitzgerald wrote two, and Justices Garman, Kilbride and Karmeier wrote one apiece.  The following year, Justice Freeman again led with three majority opinions.  Justice Garman wrote two, and Chief Justice Fitzgerald and Justice Karmeier wrote one each.  Finally, in 2009, Chief Justice Fitzgerald and Justice Karmeier each wrote three majorities in non-unanimous criminal cases.  Justices Freeman and Kilbride wrote two each, and Justice Garman wrote one.

Table 368

In Table 369 below, we report the distribution as a percentage of the total non-unanimous criminal decisions.  In 2005, Chief Justice McMorrow and Justices Garman, Kilbride and Fitzgerald each wrote twenty percent of the Court’s non-unanimous criminal decisions.  In 2006, Justice Garman wrote 35.71% of the non-unanimous criminal decisions.  Justice Fitzgerald wrote 21.43% of the cases, and Justice Karmeier wrote 14.29%.  In 2007, Justice Freeman wrote 37.5% of the non-unanimous criminal decisions.  Justices Garman, Kilbride and Karmeier wrote 12.5% each.  The following year, Justice Freeman wrote 42.86% of the non-unanimous criminal cases.  Justice Garman wrote 28.57%, and Justices Karmeier and Fitzgerald wrote 14.29% each.  In 2009, Chief Justice Fitzgerald and Justice Karmeier wrote 27.27% of the non-unanimous criminal cases each.  Justices Freeman and Kilbride wrote 18.18% each.

Table 369

We report the spread of majority opinions in unanimous criminal decisions in Table 370 below.  In 2005, Justice Freeman led the Court with nine unanimous criminal majority opinions.  Justice Thomas wrote eight, Chief Justice McMorrow wrote seven.  Justice Karmeier wrote six and Justices Garman, Kilbride and Fitzgerald wrote five apiece.  In 2006, Justices Fitzgerald and Kilbride led the Court with seven majority opinions each.  Chief Justice Thomas wrote six, and Justices Freeman and Karmeier wrote five apiece.  Chief Justice McMorrow and Justice Garman wrote two majorities, and Justice Burke wrote one.  The following year, Justices Burke and Thomas led with four majorities each in unanimous criminal cases.  Justices Garman, Kilbride and Karmeier wrote three each, and Justice Freeman wrote two.  In 2008, Justice Burke led the Court, writing eight majority opinions in unanimous criminal decisions.  Chief Justice Thomas and Justices Karmeier and Fitzgerald wrote seven apiece, Justice Garman wrote six, Justice Freeman four and Justice Kilbride wrote two.  In 2009, Chief Justice Thomas and Justice Burke led with seven majority opinions apiece.  Justices Garman and Freeman wrote six apiece, Justice Kilbride wrote five, Chief Justice Fitzgerald four and Justice Karmeier three.

Table 370

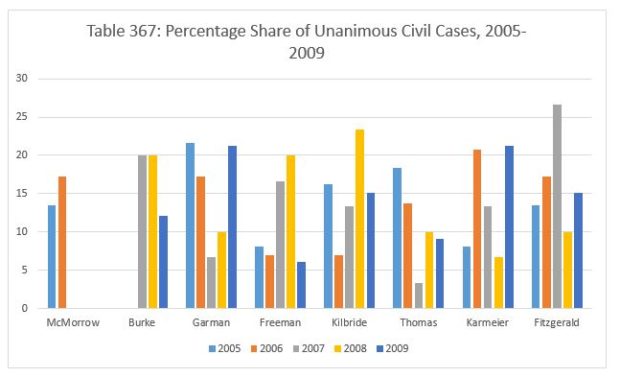
In 2005, Justice Freeman wrote twenty percent of the Court’s majority opinions in unanimous criminal cases.  Justice Thomas wrote 17.78% and Chief Justice McMorrow wrote 15.56%.  In 2006, Justice Fitzgerald wrote twenty percent of the Court’s unanimous majorities in criminal cases.  Chief Justice Thomas wrote 17.14%, and Justices Freeman and Karmeier wrote 14.29% each.  For 2007, Chief Justice Thomas and Justice Burke wrote 21.05% of the majority opinions.  Justices Garman, Kilbride and Karmeier wrote 15.79% apiece.  In 2008, Justice Burke wrote 19.51% of the Court’s unanimous majorities.  Chief Justice Thomas and Justices Karmeier and Fitzgerald wrote 17.07% apiece, and Justice Garman wrote 14.63%.  In 2009, Chief Justice Thomas and Justice Burke led the Court with 18.42% of the unanimous criminal majorities.  Justices Garman and Freeman were next at 15.79% apiece.

Table 371

Join us back here next Tuesday as we turn our attention to the Court’s majority opinions between 2010 and 2016.

Image courtesy of Flickr by Adam Moss (no changes).


2125443269_9ca854b5b0_z

Last week, we began our review of the individual Justices’ work on the Illinois Supreme Court.  We started with a look at how authorship of majority opinions was distributed year by year between 2000 and 2004.  Today, we turn to majority opinions in civil cases between 2005 and 2009.

In Table 364 below, we report the number of majority opinions written in civil cases decided non-unanimously.  For 2005, the non-unanimous majorities were evenly distributed, with Chief Justice McMorrow and Justices Garman, Freeman and Thomas each writing two opinions, and Justice Karmeier writing one.  In 2006, Justice Fitzgerald wrote five majorities.  Justice Karmeier wrote four.  Justice Freeman wrote three, and Justices Garman and Kilbride wrote two apiece.  Chief Justice Thomas and Justices McMorrow and Burke wrote one majority each.  In 2007, Chief Justice Thomas wrote three majority opinions in non-unanimous civil cases.  Justice Garman wrote two majorities, and Justices Fizgerald, Freeman and Kilbride wrote one apiece.  For 2008, Justice Garman led the Court in non-unanimous civil majorities.  Chief Justice Thomas and Justices Freeman, Karmeier and Fitzgerald wrote two apiece. In 2009, Justice Freeman wrote four non-unanimous civil majorities.  Justice Burke wrote two and Justices Garman and Fitzgerald wrote one each.

Table 364

We report the same data as a percentage of the Court’s total non-unanimous civil cases in Table 365 below.  For 2005, Chief Justice McMorrow and Justices Garman, Freeman and Thomas each wrote 22.22% of the Court’s non-unanimous civil majority opinions.  The next year, Justice Fitzgerald wrote 26.32%.  Justice Karmeier wrote 21.05%, Justice Freeman wrote 15.79%, and Justices Kilbride and Garman wrote 10.53% apiece.

In 2007, Chief Justice Thomas authored 37.5% of the Court’s non-unanimous civil majorities.  Justice Garman wrote one-quarter, and Justices Freeman, Kilbride and Fitzgerald wrote 12.5% apiece.  The next year, Justice Garman wrote 33.33% of the Court’s non-unanimous civil majorities.  Chief Justice Thomas and Justices Freeman, Karmeier and Fitzgerald each wrote 16.67%.  Finally, in 2009, Justice Freeman wrote half of the Court’s non-unanimous civil cases.  Justice Burke wrote a quarter, and Chief Justice Fitzgerald and Justice Garman wrote 12.5% apiece.

Table 365

The distribution of majority decisions in unanimous civil cases is reported in Table 366 below.  Justice Garman wrote eight majorities in 2005.  Justice Thomas was next with seven.  Justice Kilbride wrote six.  Chief Justice McMorrow and Justice Fitzgerald wrote five apiece.  In 2006, Justice Karmeier led the Court with six majorities in unanimous civil cases.  Chief Justice McMorrow and Justices Garman and Fitzgerald wrote five apiece, Chief Justice Thomas wrote four and Justices Freeman and Kilbride wrote two each.  In 2007, Justice Fitzgerald led the Court with eight unanimous civil majorities. Justice Burke was next with six, Justice Freeman wrote five majorities, Justices Kilbride and Karmeier wrote four each.  Justice Garman wrote two majorities and Chief Justice Thomas wrote one.  For 2008, Justice Kilbride led the Court with seven majority opinions in civil cases.  Justices Burke and Freeman each wrote six.  Chief Justice Thomas and Justice Fitzgerald and Garman wrote three apiece.  Justice Karmeier wrote two majority opinions.  In 2009, Justices Karmeier and Garman led with seven majorities apiece.  Chief Justice Fitzgerald and Kilbride wrote five each.  Justice Burke wrote four, Justice Thomas wrote three and Justice Freeman wrote two.

Table 366

In 2005, Justice Garman wrote 21.62% of the Court’s unanimous civil decisions.  Justice Thomas wrote 18.42%.  Justice Kilbride wrote 16.22%.  Chief Justice McMorrow and Justice Fitzgerald wrote 13.51% apiece.  In 2006, Justice Karmeier wrote 20.69% of the Court’s unanimous civil majorities.  Chief Justice McMorrow and Justices Fitzgerald and Garman wrote 17.24% apiece.  Chief Justice Thomas wrote 13.79%.  For 2007, Justice Fitzgerald wrote 26.67% of the unanimous civil majorities.  Justice Burke wrote 20% and Justice Freeman wrote 16.67%.  The following year, Justice Kilbride led the Court with 23.33% of the unanimous civil majorities. Justices Burke and Freeman wrote 20% apiece.  Finally, for 2009 Justices Karmeier and Garman each wrote 21.21% of the Court’s unanimous civil majorities.  Chief Justice Fitzgerald and Justice Kilbride each wrote 15.15%, and Justice Burke wrote 12.12%.

Table 367

Join us back here tomorrow as we turn our attention to the Court’s majority opinions in criminal cases between 2005 and 2009.

Image courtesy of Flickr by Greg Dunlap (no changes).

18799120085_d813e5aa42_z

Yesterday, we began our analysis of the work of the individual Justices at the Illinois Supreme Court by analyzing the distribution of majority opinions in civil cases between 2000 and 2004. Today, we turn our attention to the Court’s criminal docket during those same years.

Between 2000 and 2002, the non-unanimous majority opinions in criminal cases were somewhat more evenly distributed than they were on the civil side. Justice McMorrow wrote 13 non-unanimous majorities in criminal cases in 2000. Justice Rathje wrote 11 and Justice Heiple wrote 10. Justice Bilandic wrote eight, and Chief Justice Harrison and Justices Miller and Freeman wrote seven apiece. In 2001, there were many fewer non-unanimous criminal decisions. Justices McMorrow and Freeman wrote six majorities each, Justices Thomas and Fitzgerald wrote four apiece. Justice Miller wrote two majorities, and Chief Justice Harrison and Justice Garman wrote one apiece.

For 2002, Justices Garman, Freeman and Fitzgerald led the Court with six non-unanimous majorities each. Chief Justice McMorrow and Justice Thomas wrote five apiece. Justice Kilbride wrote three and Chief Justice Harrison wrote one. In 2003, Chief Justice McMorrow led the Court with five majority opinions in non-unanimous criminal cases. Justices Thomas and Fitzgerald wrote four apiece. Justice Freeman wrote three, and Justices Garman, Kilbride and Rarick wrote one each. Finally, in 2004, Justice Freeman led with four majority opinions in non-unanimous criminal cases. Chief Justice McMorrow and Justice Thomas were next with two apiece, and Justices Garman, Kilbride, Rarick and Fitzgerald wrote one apiece.

Table 360

We report the same data in Table 361 below as a percentage of total non-unanimous criminal decisions. In 2000, Justice McMorrow was responsible for 20.63% of the non-unanimous criminal decisions. Justice Rathje wrote 17.46%, Justice Heiple wrote 15.87%, and Chief Justice Harrison and Justices Miller and Freeman wrote 11.11% apiece. For 2001, Justices McMorrow and Freeman wrote one quarter of the non-unanimous criminal majorities apiece. Justices Thomas and Fitzgerald wrote 16.67% of the majorities that year.

For 2002, Justices Garman, Freeman and Fitzgerald each wrote 18.75% of the Court’s non-unanimous criminal majorities. Chief Justice McMorrow and Justice Thomas wrote 15.63%. In 2003, Chief Justice McMorrow wrote 26.32% of the Court’s non-unanimous criminal majorities. Justices Thomas and Fitzgerald wrote 21.05% each. Justice Freeman wrote 15.8%. For 2004, Justice Freeman wrote one-third of the non-unanimous criminal majority opinions. Chief Justice McMorrow and Justice Thomas wrote 16.67% apiece.

Table 361

In Table 362 below, we report the total majorities by each Justice in unanimous criminal decisions. In 2000, Chief Justice Harrison led the Court with five unanimous majorities. Justices McMorrow, Miller, Freeman, Heiple and Bilandic each wrote three. Justice Rathje wrote two. In 2001, Justice Freeman wrote six majorities. Chief Justice Harrison and Justices Thomas and Fitzgerald wrote five apiece. Justice McMorrow wrote four, Justice Garman three and Justices Miller and Kilbride wrote two unanimous criminal majorities apiece.

In 2002, Justice Thomas led with eight majority opinions in unanimous criminal decisions. Justice Fitzgerald wrote seven, Chief Justice McMorrow wrote six, and Justices Freeman and Kilbride wrote five apiece. Justice Garman wrote three majorities and Chief Justice Harrison wrote one. For 2003, Justice Fitzgerald led with nine majorities among unanimous criminal decisions. Justice Garman was next with seven, Chief Justice McMorrow wrote five, and Justices Freeman and Rarick wrote four apiece. Justice Kilbride wrote three and Justice Thomas wrote two. In 2004, Justice Rarick led with nine unanimous criminal majorities. Justices Garman and Kilbride wrote seven. Chief Justice McMorrow and Justice Thomas wrote five. Justice Fitzgerald wrote four majorities, and Justice Freeman wrote three.

Table 362

We report the data for majority opinions as a percentage of the total unanimous decisions in Table 363 below. In 2000, Chief Justice Harrison wrote 22.73% of the unanimous criminal-side majority opinions. Justices McMorrow, Miller, Freeman, Heiple and Bilandic all were responsible for 13.64% of the Court’s unanimous opinions. In 2001, Justice Freeman was responsible for 18.75% of the Court’s unanimous criminal opinions, and Chief Justice Harrison and Justices Thomas and Fitzgerald wrote 15.63% each. The next year, Justice Thomas wrote 22.22% of the Court’s unanimous majorities. Chief Justice McMorrow wrote 16.67%, and Justices Freeman and Kilbride wrote 13.89% apiece.

In 2003, Justice Fitzgerald wrote 26.47% of the Court’s unanimous criminal opinions. Justice Garman wrote 20.59%. Chief Justice McMorrow wrote 14.71%, and Justice Freeman wrote 11.76%. For 2004, Justice Rarick led the Court, writing 22.5% of the Court’s unanimous criminal opinions. Justices Kilbride and Garman wrote 17.5% each. Chief Justice McMorrow and Justice Thomas were responsible for 12.5% of the Court’s unanimous criminal majority opinions apiece.

Table 363

Join us back here next Tuesday as we turn our attention to the Court’s majority opinions between 2005 and 2009.

Image courtesy of Flickr by Natalie Maynor (no changes).

4541395155_5c8daeaea5_z

Today, we begin a new phase of our analysis of the Illinois Supreme Court’s recent history, as we turn our attention to the work of the individual Justices. Over the next two months, we’ll be assessing how influential individual Justices appear to be in swaying the Court to their point of view. First up: have any of the Justices tended to write more of the Court’s majority opinions than others? Nearly all appellate courts try to equalize the workload among the Justices, so the “default” value would be that each sitting Justice writes one-seventh of the total majority opinions. But of course, one has to actually be in the majority to be assigned the majority opinion.

Today, we’ll address the civil docket between 2000 and 2004. Tomorrow, we’ll turn to the criminal docket for the same years, and over the next two weeks, we’ll address the years 2005-2009 and 2010-2015.

In Table 356 below, we report the total number of majority opinions written by each Justice in civil cases decided with dissent between 2000 and 2004. One might expect a Justice very much in the mainstream of the Court’s thought to frequently vote with the majority in non-unanimous decisions, and therefore frequently find himself or herself writing the majority opinion.

In 2000, the bulk of majorities in non-unanimous civil cases were spread among four Justices – Justices Rathje and Bilandic with four each, and Justices McMorrow and Miller with three each. Chief Justice Harrison and Justice Heiple wrote one each. The following year, non-unanimous majorities were more spread out. Chief Justice Harrison and Justice Thomas wrote three each, Justice Garman and Justice Freeman wrote two apiece, and Justices McMorrow, Miller and Fitzgerald wrote one each. In 2002, Justice Fitzgerald led the Court, writing four non-unanimous civil majorities. Chief Justice McMorrow and Justices Garman and Freeman wrote three each. Chief Justice Harrison wrote two, and Justices Kilbride and Thomas wrote one apiece. The next year, Justice Rarick led the Court, writing four non-unanimous majorities in civil cases. Justices Freeman and Kilbride wrote three each. Justice Garman wrote two, and Chief Justice McMorrow and Justice Freeman wrote one apiece. The distribution shifted yet again in 2004. That year, Justice Freeman wrote five majority opinions in non-unanimous civil cases. Chief Justice McMorrow wrote three, and Justices Garman and Kilbride wrote two each. Justices Rarick and Fitzgerald wrote one majority opinion apiece.

Table 356

In Table 357 below, we report the same data, with each Justices’ year computed as a fraction of all the Court’s non-unanimous civil decisions. In 2000, Justices Bilandic and Rathje wrote half of the Court’s total non-unanimous civil majorities between them. Justices McMorrow and Miller wrote 18.75% each. In 2001, Chief Justice Harrison and Justice Thomas each wrote 23.08% of the cases. Justices Garman and Freeman wrote 15.38% each. For 2002, Justice Fitzgerald was responsible for 23.53% of the non-unanimous civil majorities, and Chief Justice McMorrow and Justices Garman and Freeman wrote 17.65% apiece. Chief Justice Harrison wrote 11.76%. In 2003, Justice Rarick wrote 28.57% of the Court’s non-unanimous majorities, and Justices Kilbride and Freeman wrote 21.43% apiece. Justice Garman wrote 14.29% of the majorities. In 2004, Justice Freeman wrote 35.71% of the non-unanimous civil decisions. Chief Justice McMorrow wrote 21.43%. Justices Garman and Kilbride wrote 14.29% of the cases.

Table 357

In Table 358, we report the total majority opinions written by each Justice in civil cases decided unanimously between 2000 and 2004. Note that the distribution appears to be somewhat more uneven than the distribution of non-unanimous decisions. Chief Justice Harrison wrote the most unanimous civil majorities in 2000 with six, followed by Justice Miller with 4 and Justices Freeman and Bilandic with three each. Justice McMorrow wrote two majority opinions and Justice Rathje one. Justice McMorrow led the Court in 2001, writing ten unanimous civil majorities. Justice Freeman wrote eight, Justices Thomas and Fitzgerald wrote five apiece, Chief Justice Harrison and Justice Garman wrote three each. Justice Miller and Kilbride wrote two unanimous civil majorities apiece.

In 2002, Justice Kilbride wrote nine unanimous civil majorities. Justices Freeman and Fitzgerald wrote five apiece. Chief Justice McMorrow, Justice Garman and Justice Thomas wrote four each. Chief Justice Harrison wrote two. The next year, Justice Thomas led the Court with seven unanimous civil majorities. Chief Justice McMorrow wrote six. Justice Freeman and Kilbride wrote five majorities apiece, and Justices Garman, Rarick and Fitzgerald wrote three apiece. In 2004, Justices Fitzgerald and Rarick led the Court with eight unanimous civil majorities each. Justices Kilbride and Garman wrote six apiece. Justice Thomas wrote five and Justice Freeman wrote three.

Table 358

We report the data on unanimous civil decisions as a percentage of the Court’s total docket in Table 359 below. In 2000, Chief Justice Harrison wrote 27.27% of the unanimous civil decisions. Justice Miller wrote 18.18% of the cases, and Justices Freeman, Heiple and Bilandic wrote 13.64% each. The next year, Justice McMorrow wrote 26.32% of the unanimous civil decisions. Justice Freeman wrote 21.06%, and Justices Thomas and Fitzgerald wrote 13.16% apiece.

In 2002, Justice Kilbride wrote 27.27% of the unanimous civil majorities. Justices Fitzgerald and Freeman wrote 15.15%, and Chief Justice McMorrow and Justices Garman and Thomas wrote 12.12% of the cases each. The next year, the caseload was somewhat more evenly distributed, as Justice Thomas wrote 21.88% of the cases, Chief Justice McMorrow 18.75% and Justices Freeman and Kilbride 15.63% apiece. Finally, in 2004, Justices Rarick and Fitzgerald were responsible for 21.05% of the unanimous civil majorities apiece. Justices Garman and Kilbride wrote 15.79% each, and Justice Thomas added another 13.16%.

Table 359

Join us back here tomorrow as we turn our attention to the majority opinions in criminal cases between 2000 and 2004.

Image courtesy of Flickr by Matt Turner (no changes).

13914308220_a1d9bde20e_z

For the past two weeks, we’ve been reviewing the Illinois Supreme Court’s recent history with amicus briefs.  Today, we turn our attention to the criminal and quasi-criminal docket between 2008 and 2015.

Amicus briefs were far more common in civil cases than in criminal matters between 2008 and 2015 – just as was the case between 2000 and 2008.  In fact, as we see in Table 354 below, the Court accepted no amicus briefs at all in criminal cases between 2008 and 2010.  In 2011, the Court accepted four briefs in unanimously decided cases, but none in non-unanimous cases.  In 2012, the Court allowed four amicus briefs in cases decided with dissents to three in unanimous decisions.  The following year, the Court accepted eight amicus briefs in non-unanimous cases to only three in unanimous ones.  In 2014, the Court allowed only one amicus brief in a non-unanimous criminal case, but allowed 13 in unanimous ones.  Last year, the Court allowed no amicus briefs in criminal cases decided unanimously, but allowed six in unanimous decisions.

Table 354

We report the average number of briefs per case on the criminal side in Table 355 below.  Of course, the average for the years 2008 through 2010 is zero.  In 2011, the Court averaged 0.11 extra briefs in unanimous criminal decisions.  In 2012, the Court averaged 0.4 amicus briefs in non-unanimous decisions to 0.13 in unanimous ones.  In 2013, the Court averaged 0.62 amicus briefs per case in non-unanimous decisions to 0.12 extra briefs in unanimous decisions.  In 2014, the Court averaged only 0.14 amicus briefs in non-unanimous cases, but accepted 0.48 briefs per case on the unanimous side of the ledger.  Last year, the Court accepted no amicus briefs in non-unanimous criminal decisions, but averaged 0.22 amicus briefs in unanimously decided cases.

Table 355

Join us back here next Tuesday as we turn our attention to another new issue: which Justices have written the longest and shortest opinions year by year since 2000?

Image courtesy of Flickr by David Wilson (no changes).

6502476769_b9b5064fb7_z

Last week, we began our examination of the Illinois Supreme Court’s experience since 2000 with amicus briefs, analyzing the years 2000 through 2007 on both the civil and criminal side of the docket.  This week, we’ll turn our attention to the Court’s experience between 2008 and 2015.

In Table 352 below, we report the total number of amicus briefs the Court has accepted for filing in civil cases each year.  Early in this period, amicus briefs tended to be more commonplace in cases which the Court eventually decided with dissents than in unanimous decisions.  In 2008, the Court accepted nineteen amicus briefs in non-unanimous decisions to only fifteen in the unanimously decided cases.  The following year, there were only twelve amicus briefs in non-unanimous decisions to twenty-five in unanimous ones, but in 2010, the two sides of the docket had switched positions again – the Court accepted 26 amicus briefs in non-unanimous decisions, but only 14 in unanimous ones.

Since then, amicus briefs have tended to be more common in cases which the Court decided unanimously.  In 2011, the Court accepted 10 briefs in non-unanimous decisions to 26 in unanimous ones.  In 2012, the spread was even – nineteen briefs each in non-unanimous and unanimous cases. But in 2013, the Court accepted nine briefs in non-unanimous cases to 22 in unanimous ones.  In 2014, the Court accepted only four amicus briefs in non-unanimous civil decisions, but took 15 in unanimous decisions.  Last year, the Court allowed nine amicus briefs in non-unanimous civil decisions, but amicus briefs in unanimous decisions were up even further, with 24 being filed.

Table 352

In Table 353, we report the same data as an average number of briefs per case. From 2008 through 2012, the Court averaged more amicus briefs per case in non-unanimous decisions than unanimous ones.  This could have two possible explanations, of course; it could be that more controversial cases both attract amicus participation and dissent on the Court.  Or, it could be that amicus briefs tend to increase the likelihood of dissent (or perhaps, some of both).  In 2008, the Court averaged 1.58 briefs in non-unanimous decisions to only 0.5 in unanimous ones.  The following year, the Court averaged 1.5 extra briefs in non-unanimous decisions to 0.76 in unanimous cases.  In 2010, the numbers were even more lopsided – the Court averaged 2.89 amicus briefs in non-unanimous decisions, but only 0.58 in unanimous cases.

In the years since, the numbers have been somewhat more even. In 2011, the Court averaged 1.11 amicus briefs in non-unanimous decisions to 0.9 in unanimous ones.  The following year, the averages were 1 in non-unanimous cases to 0.9 in unanimous cases.  In 2013 and 2014, the Court actually averaged slightly more amicus briefs in cases decided unanimously – 0.64 and 0.67 for non-unanimous decisions in 2013 and 2014 to 1.1 and 0.71 for unanimous decisions. Last year, the two sides returned to their expected relationship, as the Court averaged one amicus brief per case in non-unanimous decisions (its highest figure since 2012) to 0.71 on the unanimous side.

Table 353

Join us back here tomorrow as we address the Court’s experience with amicus briefs on the criminal side between 2008 and 2015.

Image courtesy of Flickr by Dalton Reed (no changes).

14897209141_54633630ab_zYesterday, we began our review of the Illinois Supreme Court’s experience with amicus briefs with the data for civil cases between 2000 and 2007.

Amicus briefs were far less common on the criminal side of the docket during these early years of our period.  The Court accepted three amicus briefs in non-unanimous criminal decisions in 2000, and one each among unanimous criminal decisions in 2001, non-unanimous criminal decisions in 2002 and 2004, and unanimous criminal decisions in 2004.  In 2006, the Court accepted three amicus briefs in non-unanimous criminal decisions.

Table 350

All this, of course, adds up to a very low median number of amicus briefs per case for criminal cases.  In 2000, the Court averaged 0.05 amicus briefs in non-unanimous decisions.  The following year, the Court averaged 0.3 briefs in unanimous decisions.  The following year, the Court averaged 0.03 amicus briefs in non-unanimous cases.  In 2004, the Court averaged 0.8 amicus briefs in non-unanimous criminal cases to 0.02 briefs per case in unanimous decisions.  Finally, in 2006, the Court averaged 0.2 amicus briefs per non-unanimous decision.

Table 351

Join us back here next week as we turn our attention to amicus briefs between 2008 and 2015.

Image courtesy of Flickr by Roman Boed (no changes).


15807959696_a599428eae_z

Last week, we completed our review of the Illinois Supreme Court’s dissents between 2000 and 2016.  Today, we begin our analysis of the Supreme Court’s amicus briefs.

We report total amicus briefs in civil cases in Table 348 below.  The Court accepted 16 amicus briefs in non-unanimous decisions in 2000, 15 in 2001 and 15 the following year.  During those same three years, the Court accepted five, fifteen and twenty-six amicus briefs (respectively) in unanimous cases.

In 2003, the Court accepted only 7 amicus briefs in non-unanimous civil decisions, to 17 on the unanimous side.  The following year, the Court filed 16 amicus briefs among non-unanimous decisions on the civil side to 40 on the unanimous side.  In 2005, there were 35 amicus briefs in non-unanimous cases, to 42 on the unanimous side.  In 2006, there were twenty-three amicus briefs filed in non-unanimous civil cases to 26 briefs in unanimous decisions.  Finally, in 2007 the Court filed eight amicus briefs in non-unanimous civil decisions to 19 among unanimous decisions.

Table 348

We report the average briefs per case in Table 349 below.  In 2000, the Court averaged one amicus brief in non-unanimous civil cases, and 0.23 briefs in unanimous decisions.  The following year, the Court averaged 1.15 amicus briefs in non-unanimous civil decisions and 0.39 in unanimous cases.  The following year, amicus briefs fell to an average of 0.88 among non-unanimous decisions.  The Court averaged 0.79 amicus briefs per case in unanimous decisions. 

The Court averaged 0.5 amicus briefs in non-unanimous civil decisions in 2003, to 0.53 briefs in unanimous civil decisions.  The data remained flat in 2004 – the Court averaged 1 amicus brief per case in non-unanimous civil decisions to 1.05 briefs in unanimous decisions.

In 2005, the Court averaged 3.89 amicus briefs per case in non-unanimous cases, to only 1.08 in unanimous ones.  The following year, the data returned to baseline: 1.15 average amicus briefs in non-unanimous cases, 0.9 in unanimous decisions.  Finally, in 2007, the Court accepted one amicus brief per case in non-unanimous decisions, to 0.58 in unanimous cases.

Table 349

Join us back here tomorrow as we examine the amicus briefs in criminal cases between 2000 and 2007.

Image courtesy of Flickr by Ron Frazier (no changes).

6416761435_5e5e5a7877_z

Yesterday, we began our examination of trends in the Illinois Supreme Court’s civil and criminal dissents.  We discovered that dissents were at an extremely high level on the criminal side, and somewhat elevated on the civil side, but have settled down in the years since.  The average length of the civil and criminal dissents started to creep up halfway through our first eight years, before definitely increasing in the 2005-2007, when majority opinions were also edging up.

In Table 347, we report the average data for civil and criminal dissents between 2008 and 2015.  We see that for much of this period, the average length of civil and criminal dissents was fairly similar.  In 2008, civil dissents were up to 7.14 pages, while criminal dissents averaged 9 pages.  The following year, civil dissents were flat at 7.2 pages, while criminal dissents averaged 7.55 pages.  In 2010, civil dissents were up slightly to 8.1 pages.  Criminal dissents were down a bit, averaging 6.69 pages.

In 2011, dissents in civil cases were slightly longer, averaging 8.8 pages.  Criminal dissents were up slightly as well, averaging 7.14 pages.  In 2012 and 2013, dissents got noticeably shorter.  For 2012, the average civil dissent was 5.95 pages to 4.67 pages on the criminal side.  The next year, civil dissents averaged 5.8 pages to only 3.29 pages for criminal dissents.  In the most recent two years, dissents have edged back up a bit, but not reaching the levels they were at even as recently as 2011.  In 2014, the average dissent in a civil case was 6.43 pages.  The average criminal dissent was only slightly longer, at 6.86 pages.  Last year, civil dissents were up a bit, averaging 8.44 pages.  Criminal dissents, however, were down slightly at 5.83 pages.

Table 347

Join us back here next week as we turn our attention to a new subject, studying the Court’s history with amicus curiae briefs in civil and criminal cases.

Image courtesy of Flickr by Ron Frazier (no changes).

7130245837_2dbbc5590c_z

This week, we conclude our analysis of trends in the length of the Court’s opinions with a look at the Justices’ dissents.

First, let’s turn to the most fundamental question – just how common are dissents?  The data reported in Table 345 is not total cases in which at least one dissent was filed, which we have sometimes reported as the non-unanimous rate.  It’s total separately signed dissents.  When a Justice filed a written dissent from a denial of rehearing, we count that here too.

One thing is immediately obvious from reviewing the chart.  At least in criminal matters, the Court was quite divided in the years immediately leading up to the 2004 election.  The Justices filed seventy-seven dissents in criminal cases in 2000.  The figure dived, but still stayed high in the years immediately following: 34 in 2001, 44 in 2002, 26 in 2003 and 18 in 2004.  Civil dissents during those years were a bit higher than they’ve been in the years since, but only slightly – 21 in 2000, 16 in 2001, 21 in 2002, 15 in 2003 and 13 in 2004.

The stark division between the number of criminal and civil dissents has disappeared in the years since the election of incoming Chief Justice Lloyd Karmeier.  The Justices filed eleven dissents each in civil and criminal cases in 2005.  In 2006, they filed twenty dissents in civil cases, 16 in criminal cases.  In 2007, there were only eight civil dissents to 10 on the criminal side.  In 2008, there were fourteen civil dissents, but there were ten each in 2009, 2010 and 2011.  There were eight dissents in criminal cases in 2008, 11 in 2009, 13 in 2010 and 15 in 2011.  Dissents reached their highest level in recent years on the civil side in 2012 at 20, with 12 being filed on the criminal side.  For the next two years, the sides of the docket were almost evenly matched – 15 civil in 2013, 7 in 2014 to 14 criminal in 2013, 7 in 2014.  Last year, there were nine dissents filed on the civil side to six on the criminal side.

Table 345

We’ve noticed in our earlier work that majority opinions (but not concurrences) seemed to be getting a bit longer late in the period 2000-2007.  We see an interesting result in Table 346 below – dissents weren’t especially long in the period 2000-2003, when dissents were commonplace.  They started to get a bit longer beginning in 2004, when they became rarer.

In 2000, the average civil dissent was four pages, to 3.1 on the criminal side.  In 2001, civil dissents were up to 5.38 pages, although they fell to an average 4.52 in 2002.  During that same period, criminal dissents first retreated a bit in 2001 to 2.91 pages before increasing to 3.77 in 2002.  In 2003, the average civil dissent was 5.2 pages, the average criminal dissent 3.57.

In 2004, the average dissent on the civil side was up to 6.94 pages.  Criminal dissents were even longer, averaging 7.21 pages.  In 2005, civil dissents reached their highest level of the entire sixteen years, averaging 9.45 pages; but criminal dissents dropped, to 3.91 pages.  But the next year, both sides were high – civil dissents averaged 8.95 pages, criminal dissents 7.28 pages.  In 2007, dissents in civil cases were down to 5.5 pages, and criminal dissents were down slightly, remaining historically high at an average length of 6.9 pages.

Table 346

Join us back here tomorrow and we’ll review the data for the civil and criminal dissents between 2008 and 2015.

Image courtesy of Flickr by Doug Kerr (no changes).