2999130055_8697986e51_zYesterday, we looked at the evidence of a centrist voting bloc at the Court between 2005 and 2009, consisting of Chief Justice Thomas and Justices Garman and Karmeier, frequently joined by Justice Fitzgerald. Today, we look at the agreement rates among the remainder of the Justices.

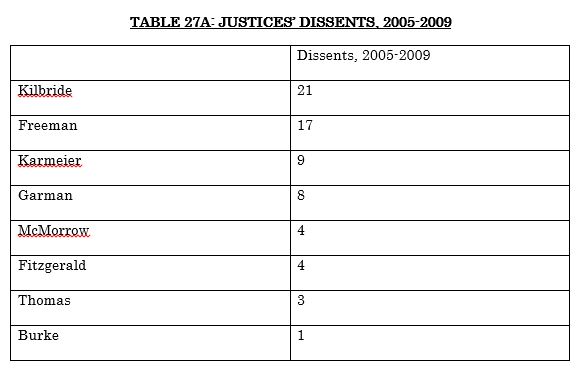
Justice Burke initially had quite high agreement rates with nearly all members of the Court, but after several years, she was most closely identified with Justice Freeman (77.8%, 89.5%, 95.7%.) Similarly, Justice Karmeier’s agreement rate with the other Justices was relatively high initially, but dipped slightly after a few years. Justice Kilbride, on the other hand, had a comparatively low agreement rate with most other members of the Court throughout this second five-year period.

Table 33 B

Next week, we’ll conclude our look at the years between 2005 and 2009 by looking for the swing voters in several frequently heard areas of the law. Then we’ll launch into the final five years of our study, looking at the Court’s voting dynamics in civil cases between 2010 and 2014.

Image courtesy of Flickr by Theresa Thompson (no changes).

7157055718_4bc129954f_zWith one seat on the Court switching from Democratic to Republican hands as a result of the 2004 election, a centrist majority of Chief Justice Thomas, Garman and Karmeier began to emerge, often joined by Justice Fitzgerald. As a result, with the exception of 2006 (when the unanimity rate abruptly dipped to 57.4%), the Court consistently decided between seventy and eighty percent of its cases unanimously between 2005 and 2009.

Chief Justice Thomas and Justice Garman remained closely aligned in their voting patterns throughout this second five-year period, their agreement rate drifting downwards only slightly. (87.9%; 82.9%; 75% and 78.8%.) Chief Justice Thomas and Justice Fitzgerald’s agreement rates were similar. (83.3%; 85%; 83.9%; 71.4%.) The agreement rate between Justices Fitzgerald and Garman was only slightly less. (69.4%; 80%; 82.4%; 68.4%.)

Table 33 A

Join us back here tomorrow, and we’ll consider the agreement rates among the remaining members of the Court between 2005 and 2009.

Image courtesy of Flickr by Kodak Views (no changes).

5139407571_1c81d07a8c_zFor the past two weeks, we’ve been taking an intensive look at the voting dynamics at the Illinois Supreme Court in civil cases. Today, we further probe our tentative conclusions by looking for swing votes on the Court. How often was each Justice in the majority when the Court was divided?

Table 32 A

The data largely confirms our tentative conclusions based upon the agreement rates. We see a centrist group consisting of Justices Garman, Thomas and Fitzgerald, each of whom are generally in the majority in divided decisions. The data suggests that Chief Justice McMorrow and Justices Freeman and Rarick most frequently provided the fourth vote to make a Court majority.

Let’s disaggregate the data to consider some of the most frequently heard subject matter areas in the Court’s docket. Our next table tracks the fraction of the time each Justice voted in the majority in non-unanimous tort cases. Once again, Justices Garman, Thomas and Fitzgerald are frequently in the majority, with Justices Freeman and McMorrow providing a fourth vote in nine out of every ten cases:

Table 32 B

Next, we turn to civil procedure cases. In these decisions, Justice Thomas is slightly less often in the majority of divided decisions, with the dominant voting combination consisting of Justice Garman, Chief Justice McMorrow, and Justices Freeman and Fitzgerald:

Table 32 C

Finally, we turn to the Court’s third most frequently heard area of the law, constitutional law. Although the Court heard only a few constitutional law cases during these five years, the most frequent road to a majority in such cases appears to have been somewhat different than in other areas of the law, with Chief Justice McMorrow, Justice Freeman, Justice Rarick and Justice Fitzgerald most often in the majority.

Table 32 D

Next week, we’ll begin our study of the voting dynamics on the Court between 2005 and 2009.

Image courtesy of Flickr by JustGrimes (no changes).

4446461866_2a2822cd2d_zLast week, we began our study of voting dynamics on the Illinois Supreme Court since 2000 by looking at agreement rates in non-unanimous civil cases between 2000-2004. Once again, to minimize extreme swings from one year to the next, we report three-year floating averages.

With two plurality voting blocs on the Court during these years, the two remaining seats on the Court – Justice Heiple and his successor, Justice Kilbride, and Chief Justice Harrison and his successor, Justice Rarick – arguably held the balance of power. Although Justice Rarick often voted with Justice Fitzgerald, his agreement rates were far less with Justices Garman and Thomas, suggesting that he was not often providing a fourth vote for the Garman-Thomas-Fitzgerald bloc.

Table 31 B

Tomorrow, we complete our analysis of the years between 2000 and 2004 by looking at the voting data in a somewhat different way – how often was each Justice in the majority of a non-unanimous civil decision?

Image courtesy of Flickr by Alan Cleaver (no changes).


3002112985_80b5a719b1_zFinally, we reach the most important information of all about the Court from the viewpoint of an appellate lawyer: data about the Justices’ voting patterns. Because unanimity rates overstate the degree of agreement on the Court, we focus on voting patterns in the Court’s non-unanimous civil decisions. Because the number of non-unanimous civil decisions in any particular year is relatively small, we once again report three-year floating averages rather than year-by-year data.

The Court’s unanimity rate was somewhat lower between 2000 and 2004 than in most of the years that followed. In 2000, only 57.9% of the Court’s civil cases were decided unanimously, and fully one-quarter of the Court’s cases had either two or three dissenters. In the four years that followed, with several new Justices on the Court, the Court’s unanimity rate increased somewhat to between sixty and seventy percent. In 2002 and 2004, one in every five cases ended in a significantly divided Court. Not surprisingly in view of this data, the Court seems to have lacked a consistent four-vote voting bloc during these years.

Between 2000 and 2002, Justice Garman was closely aligned with Justices Thomas and Fitzgerald (96.2% and 84.6%, respectively). Justice Freeman voted with Chief Justice McMorrow in three-quarters of the non-unanimous civil cases during that three-year period, but both Justices voted with Garman, Thomas and Fitzgerald less often.

The patterns remained quite similar through 2003 and 2004. Justice Garman voted with Justice Thomas in most non-unanimous civil cases (92.3% and 88.4%), and with Justice Fitzgerald nearly three-quarters of the time (72.5% and 72.1%). Justice Thomas voted with Justice Fitzgerald in more than eighty percent of non-unanimous civil cases. Chief Justice McMorrow continued to vote with Justice Freeman quite often (83.7% and 89.1%), but both the Chief Justice and Justice Freeman voted with Justices Garman, Thomas and Fitzgerald somewhat less often – between fifty-five and sixty-five percent of the time.

Table 31 A

Next week, we’ll continue our close analysis of the Court’s voting dynamics between 2000 and 2004.

Image courtesy of Flickr by Brett Neilson (no changes).

6883885357_85363f726e_zLast week, we began the final phase of our review of the Justices’ opinion writing with a look at the majority and concurring opinions for the years 2010 through 2014. Today, we turn to the Justices’ dissents.

Between 2010 and 2014, the Justices filed dissents at a comparable rate to the 2005-2009 period. Chief Justice Kilbride filed fewer special concurrences, but he was once again the most frequent dissenter on the centrist Court, followed by Justice Charles Freeman. Following those two Justices, the remaining members of the Court dissented with close to the same frequency.

Table 30 A

Turning to the length of the most recent dissents, we find an interesting result: although the Court’s majority opinions are trending shorter, the Justices’ dissents are somewhat longer than they were in the previous five years, particularly in the middle of the period, when the Court’s unanimity rate briefly drifted below sixty percent.

Table 30 B

Tomorrow, we begin our analysis of the Court’s voting dynamics between 2000 and 2014 – in non-unanimous civil cases, which Justices voted together most and least often? Have there been any identifiable voting blocs on the Court?

Image courtesy of Flickr by Tracie Hall (no changes).

8420275365_d14df0c7a0_zSpecial concurrences have become slightly less common on the Court recently, but this is not an indication of any increase in the level of agreement among the Justices. On the contrary, as we noted above, the unanimity rate drifted somewhat lower during much of this period. Rather, most of the decrease is attributable to Justice Kilbride writing fewer concurrences during his term as Chief.

Table 29 A

The Court’s special concurrences continued to run quite short:

Table 29 B

Next week, we’ll take a look at the Justices’ dissents between 2010 and 2014, and begin our review of the Justices’ voting patterns and agreement rates.

Image courtesy of Flickr by Paul Sableman (no changes).

1394931236_f341a3af8c_zLast week, we took a close look at the individual Justices’ special concurrences and dissents in civil cases between 2005 and 2009. Today, we turn to the opinions written by the Justices during the most recent five years of our study period, 2010-2014.

Justice Burke was the most frequent voice of the Court during the most recent five years, followed by Justices Thomas and Karmeier. Justice Theis wrote 22 majority opinions after joining the Court in late 2010, following Chief Justice Fitzgerald’s retirement. The least frequent authors of majority opinions during this final five year period were current Chief Justice Garman, Justice Kilbride, who served as Chief from 2010 through 2013, and Chief Justice Fitzgerald.

Table 28 A

As we noted earlier, the Court’s majority opinions trended somewhat shorter during this most recent five year period. For example, the three-year floating average of Justice Freeman’s civil opinions is only half today what it was in 2010. With the exception of Justice Burke – whose opinions tended to be the shortest on the Court at the outset of the period – every other Justice is writing shorter opinions as well.

Table 28 B

Tomorrow, we’ll turn to the Justices’ special concurrences between 2010 and 2014.

Image courtesy of Flickr by Katherine Johnson (no changes).

4515769681_a7461030aa_zYesterday, we continued our close look at the Justices’ writing during our second five year period with a review of the special concurrences between 2005 and 2009. Today, we turn to the Justices’ dissents.

Given that special concurrences are generally written to express at least mild disagreement with the majority’s views, it is not surprising to see Justices Kilbride and Freeman, the most frequent writers of concurrences, also leading the Court in dissents between 2005 and 2009. Indeed, fifty-seven percent of all the dissents on the Court in civil cases during this period were by these two Justices. Two of the Republican Justices, Justices Garman and Karmeier, dissented moderately often, but perhaps not quite as often as one might expect on a Court which still had a one-vote Democratic majority.

Table 27_A

Just like special concurrences, dissents tended to be somewhat longer between 2005 and 2009. Justice Freeman continued to write slightly longer dissents on average than his colleagues (with the exception of Chief Justice McMorrow, who retired in 2006), with Justices Burke and Thomas averaging only slightly shorter dissents.

Table 27_B

Next week, we’ll begin the final phase of our close review of the Justices’ writing by taking a close look at the majority opinions, special concurrences and dissents written in civil cases between 2010 and 2014.

Image courtesy of Flickr by Matt Turner (no changes).

5998737609_6e8f69fed7_zLast week, we continued our close look at the individual Justices’ writing with a review of the majority opinions in civil cases between 2005 and 2009. This week, we consider which Justices wrote the longest and shortest (and most frequent) special concurrences and dissents during those years.

Between 2005 and 2009, Justice Kilbride wrote the most special concurrences in civil cases, followed by Justices Freeman, Thomas and Karmeier.

Table 26_A

Even using three-year floating averages in place of year-by-year data, our results on the mean length of special concurrences between 2005 and 2009 are somewhat skewed by a small number of quite lengthy concurrences. Nevertheless, it is clear that special concurrences were growing somewhat longer during these years.

Table 26_B

Tomorrow, we’ll take a close look at the Justices’ dissents between 2005 and 2009.

Image courtesy of Flickr by Teemu08 (no changes).