 Yesterday, we began our review of the data regarding the Court’s handling of tort cases. Today, we’re continuing that series.
In Table 1082, we divide the Court’s tort cases each year according to who won at the Appellate Court – the plaintiff or defendant? Although review of plaintiffs’ wins dropped off in 2004 and 2005, across the entire period, the Court reviewed 53 cases won by the plaintiff below and 46 won by the defendant. The yearly numbers seldom diverge by much; the Court reviewed twelve plaintiffs’ wins in 2002 to four defendants’ wins. In 2005, the Court reviewed six defendants’ wins but zero plaintiffs. In 2009, it was seven plaintiffs’ wins to one defense win.

Between 2000 and 2009, defendants who won at the Appellate Court lost nearly as many cases at the Supreme Court as they won: 19 wins, 18 losses. As the Table shows the yearly won-loss numbers are almost always very close.

Plaintiffs who won at the Appellate Court had a much different story, however, winning 23 cases at the Supreme Court while losing 42. In 2001, winning plaintiffs from the Appellate Court lost all four cases at the Supreme Court. In 2004, winning plaintiffs were 2-6 at the Supreme Court. In 2009, they were 1-6.

Next, we combine the last two measurements to derive an overall won-loss record at the Supreme Court for defendants in tort cases. Between 2000 and 2009, tort defendants won 61 cases and lost 41. Only in 2003 and 2007 did defendants’ performance slip under a .500 winning percentage (4-5 in 2003 and 3-4 in 2007). The numbers were particularly lopsided in 2001, when defendants won seven of eight cases, 2004, when defendants were 9-3, and 2009, when defendants won six of eight cases.

Next, we categorize the tort cases by the principal issue involved. For the period, the Court decided more cases addressing procedural issues than anything else: 38 in all. The Court decided 32 cases involving questions of tort duties and 27 which involved liability cases.

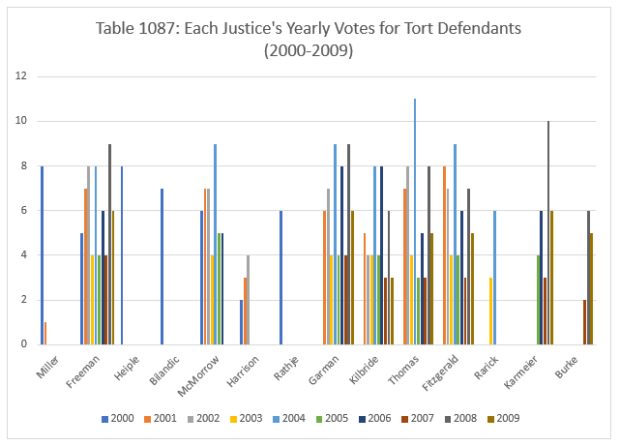
Next, we review each Justice’s total votes for defendants in tort cases. For this decade, the Justices most often supporting insurers’ positions were Justice Freeman (61 votes), Justice Garman (57), Justice Thomas (54), Justices Kilbride and Fitzgerald (45 each), and Justice McMorrow (43).
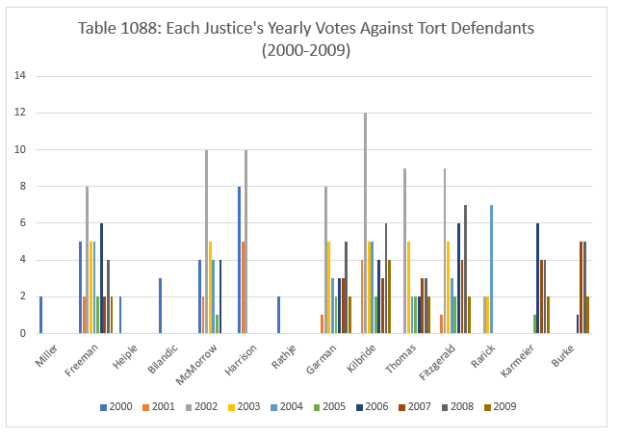
In Table 1088, we report the yearly total votes of each Justice against tort defendants. The most frequent are Justice Kilbride (45 votes), Justice Freeman (41), Justice Garman (32) and Justice McMorrow (30).
Next, we report the yearly tort cases for our final period, 2010 to 2018. The Court’s docket of tort cases steadily fell in recent years, as the graph shows. The Court decided nine tort cases in 2010, twelve in 2011, ten in 2012, but then only four in 2013, five in 2014, seven in 2015, six in 2016, seven in 2017 and two in 2018.

Although the tort docket has been falling, the cases the Court has agreed to review have overwhelmingly been plaintiffs’ wins from the Appellate Court: 48 plaintiffs’ wins, 14 defendants’ wins. Only in 2010 and 2016 did defendants’ wins narrowly predominate. Meanwhile, between 2011 and 2015, the Court decided thirty-four cases won by plaintiffs at the Appellate Court to only four cases won by defendants. After the one-year flip in 2016, the trend reasserted itself – for 2017-2018, the Court decided 8 plaintiffs’ wins below to only 1 case won by defendants.

Join us back here next Tuesday as we conclude our series on the Court’s tort law history, including a comparison of the Justices’ individual voting record to the courtwide results data.
Image courtesy of Flickr by Richie Diesterheft (no changes).