
Today, we turn to a related question: do a party’s chances of winning fall as the questioning becomes more lopsided? What about the vote – is counsel who gets far more questions than his or her opponent likely looking at a 7-0 loss?
Let’s begin with the simplest way of addressing the question. For the entire seven year period between 2008 and 2014, losing parties averaged 4.43 questions more than winning parties. However, the standard deviation of that variable was 11.56 – meaning that the difference between losing parties’ total questions and winning parties’ total questions varied widely, including a not insignificant number of cases in which the winning party received more questions.
Nor was the wide variation in questioning restricted to split decisions. Losers of unanimous decisions averaged only 4.24 questions more than their opponents. That variable had a standard deviation of 11.998 – again suggesting a wide variety of results.
Nevertheless, it is true that a party’s chances of winning fall as the difference in the number of questions asked the two sides increases. Between 2008 and 2014, parties getting at least five questions more than their opponent were 48-106 – a winning percentage of only 31.69%. Parties getting ten questions or more than their opponent were even less likely to win, going 21-71 over the seven years – a winning percentage of 22.83%. But as arguments became even more lopsided, parties’ chances of winning didn’t fall much more. Parties who received at least twenty questions more than their opponents were 5-21 over the seven years, a winning percentage of 19.23%.
Let’s try plotting the data on a scatter chart. The horizontal axis below is the difference between total questions asked the losing party and total questions to the winner. Where the winner received more questions, we report a negative number. The vertical axis is the votes for the losing party minus the votes for the winner – in other words, the magnitude of the loss, ranging from a one vote difference up to seven.
If more lopsided questioning suggested that the case would ultimately not be close, we would expect this data scatter to move from the lower left, suggesting small question differences when the difference in votes is small, to the upper right – large question differences in 7-0 cases. But if anything, the data appears to have something of an hourglass shape:
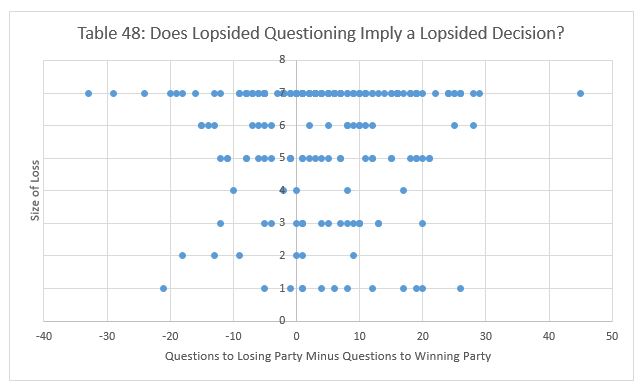 We confirm the implications of the scatter plot by calculating the correlation between the margin of questions and the difference in votes. Correlation is the statistical measure which determines to what degree two variables move together. If two variables are completely linked – an increase in one leads to an equal increase in the other – then the correlation is one. The correlation between the questions margin and the votes margin, however, is only 0.02086. Thus, although the odds against a party winning slowly lengthen as questioning gets more lopsided, getting far more questions than your opponent is not a reliable indicator that counsel is in danger of a 7-0 loss.
Next week, we’ll continue to analyze what we can predict from oral arguments in which one side receives significantly more questions than the other. Does heavy questioning suggest a longer opinion?
Image courtesy of Flickr by Hector Alejandro (no changes).